
 Samuel·5d ago

Zcash price analysis across five timeframes plus the CoinGlass heatmap, mapping the $1,680 sweep, the $1,550 liquidation band, and levels ZEC must hold now.
One candle on the Zcash daily chart looks like a typo. Early Wednesday, UTC, ZEC poked up to $1,679.83. Fast forward to that night and it’d slid to $1,476, something like 12% under the high, with the session closing near $1,498.
Price kept sliding into Thursday. Today’s low is $1,456.92. The coin is changing hands around $1,465 as this goes out, which still leaves it up about 73% for September. Not a subtle move. The setup behind it is worth taking apart, though, one timeframe at a time.
Start zoomed all the way out. September is the tallest monthly candle on the chart, opening near $848 and stretching past $1,679. Older reference points look tiny next to it. The 2021 peak? Roughly $373. November 2025’s spike felt enormous back then, and it stalled at $750.
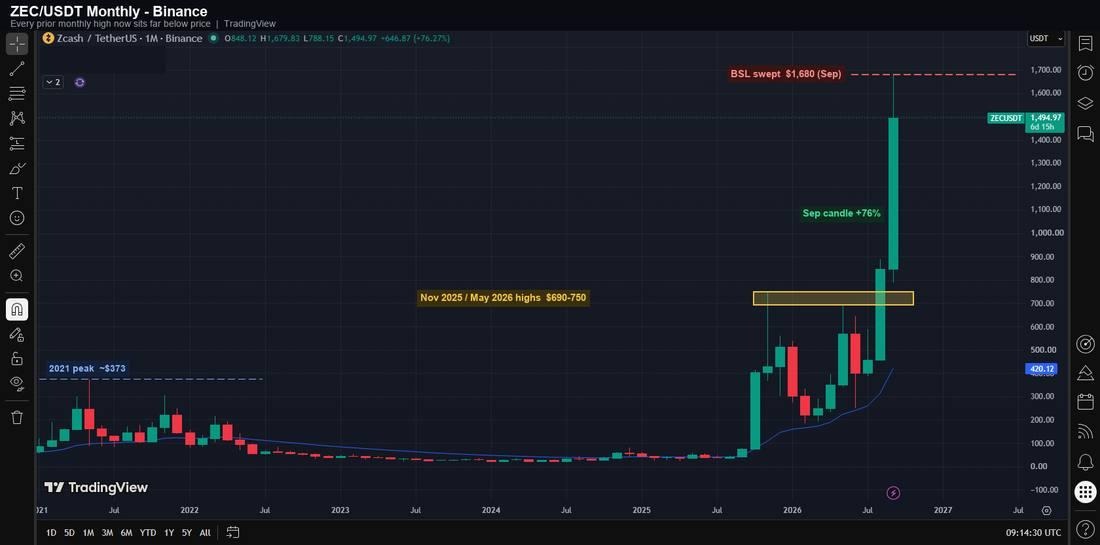
ZEC/USDT Monthly chart. Source: TradingView / Binance.
Funny thing is, that $750 wick matters more than it first seems. May 2026 ran back up and stalled at $690, which gave ZEC a $690 to $750 shelf that turned it away twice. Late August ripped straight through it. These days the band reads as support instead of a ceiling.
The weekly candles from August 17 on left a fair value gap between $516 and $752. Price barely traded through that stretch on the way up. Under that sits a weekly order block, the last red bar before the breakout, covering $466 to $516. Nobody’s calling for a trip back that deep. It just shows how little price history sits under this move.
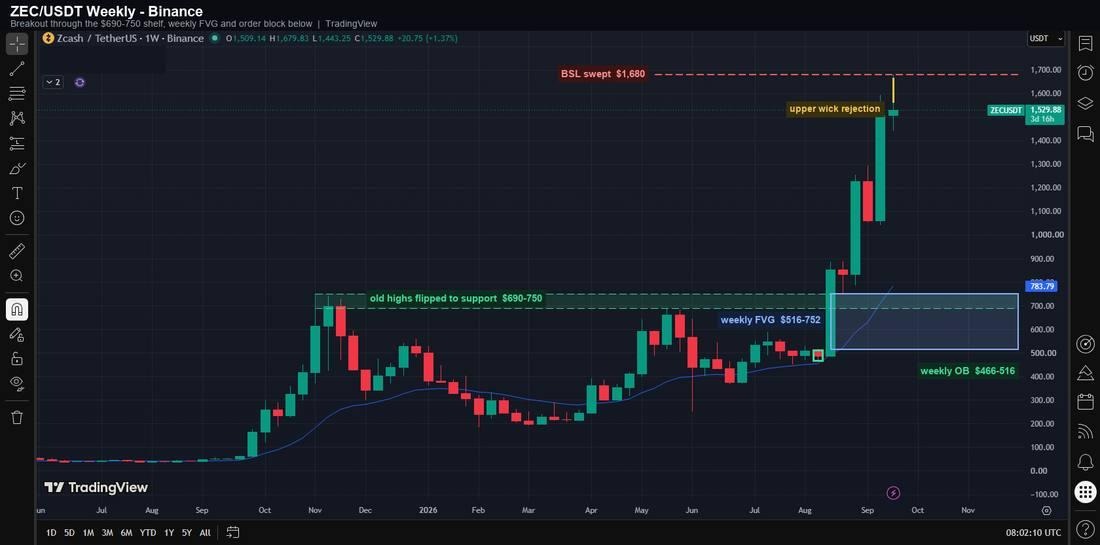
ZEC/USDT Weekly chart. Source: TradingView / Binance.
The trigger wasn’t a chart pattern anyway. Grayscale’s Zcash ETF, ticker ZCSH, began trading on NYSE Arca on August 25. The sponsor called it the first exchange-traded product with spot ZEC exposure. ZEC was in the $800s that week. It crossed $1,000 about ten days later.
Regulated access keeps widening for altcoins generally, with CME Group adding BCH and UNI futures this week. Zcash just happened to be the privacy pick that got a spot product first.
Back on the daily chart, the launchpad was September 14. ZEC dipped to $1,041.70, under a cluster of matching lows near $1,054 to $1,060, and the stops under them got taken. Two sessions later, the coin jumped about 20% in one day and closed at $1,338, breaking the $1,296 swing high on the way. A sweep first, then a break in structure. Textbook order.
The September 15 candle, the last red one before the jump, is the bullish order block at $1,086 to $1,169. Above it sits a daily fair value gap from $1,169 to $1,327 that price hasn’t revisited. Halfway down the whole swing, $1,041 to $1,680, is $1,361, and the daily moving average is climbing under $1,292. Those numbers keep landing in one neighborhood.
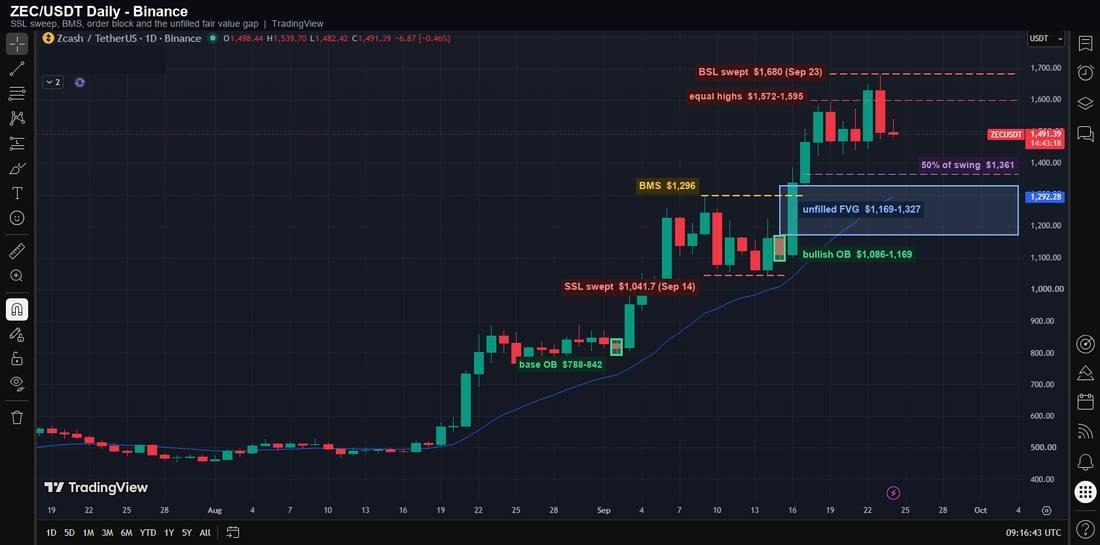
ZEC/USDT Daily chart. Source: TradingView / Binance.
Over on the four-hour chart, ZEC sat boxed in between $1,427 and $1,595 from September 19 to 22, more or less. Equal highs were stacked just under $1,600, equal lows near $1,430, and that’s exactly where stops like to hide. Wednesday’s spike took the top first, printed $1,680, then ran straight back into the range.
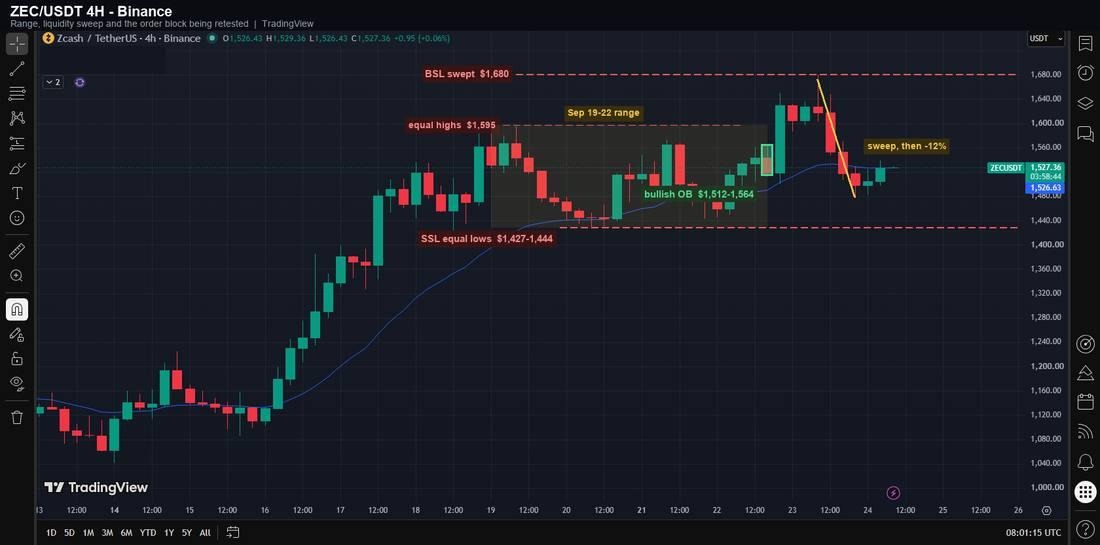
ZEC/USDT 4H chart. Source: TradingView / Binance.
The one-hour view shows how quick the flip was. That $1,680 print came at 10:00 UTC. By mid-afternoon, price had broken $1,586, the last swing low, a change of character that turned the short-term bias lower. A bearish order block at $1,619 to $1,644 capped the bounce. The four-hour bullish block at $1,512 to $1,564 has already been dropped through.
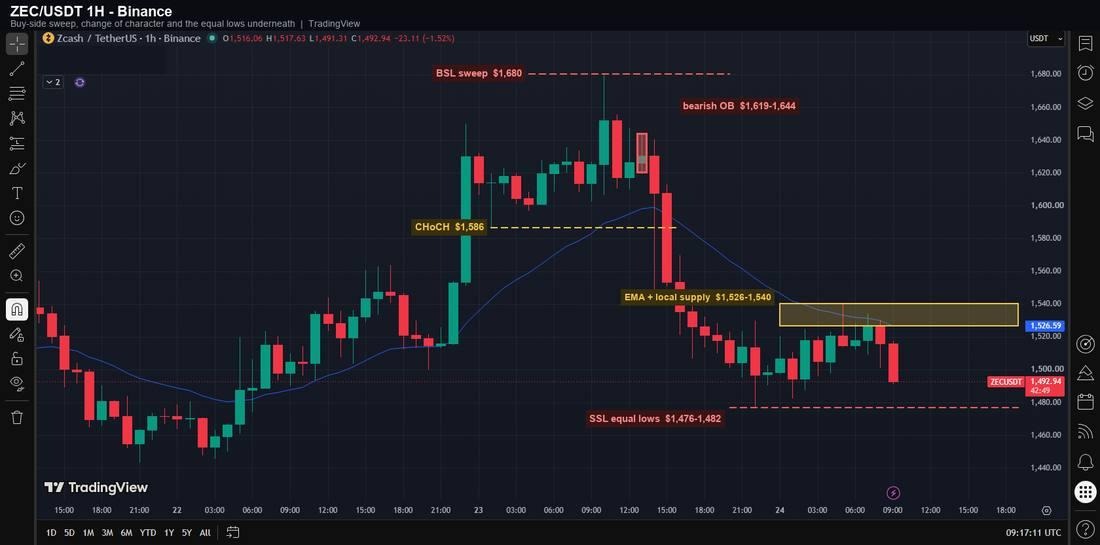
ZEC/USDT 1H chart. Source: TradingView / Binance.
The equal lows at $1,476 to $1,482 lasted until Thursday morning too. They’ve gone now. That leaves the four-hour lows at $1,427 to $1,444 as the next obvious pool, somewhere between 1% and 3% below where the coin trades.
According to CoinGlass, the Binance ZEC/USDT liquidation heatmap paints its densest band at $1,550 to $1,565, above price. Another bright stripe sits near $1,683, just over Wednesday’s wick. Those are the spots where forced closing would pile up on a rally. Below price, the clusters stack between $1,435 and $1,490, and ZEC is standing inside that zone right now.
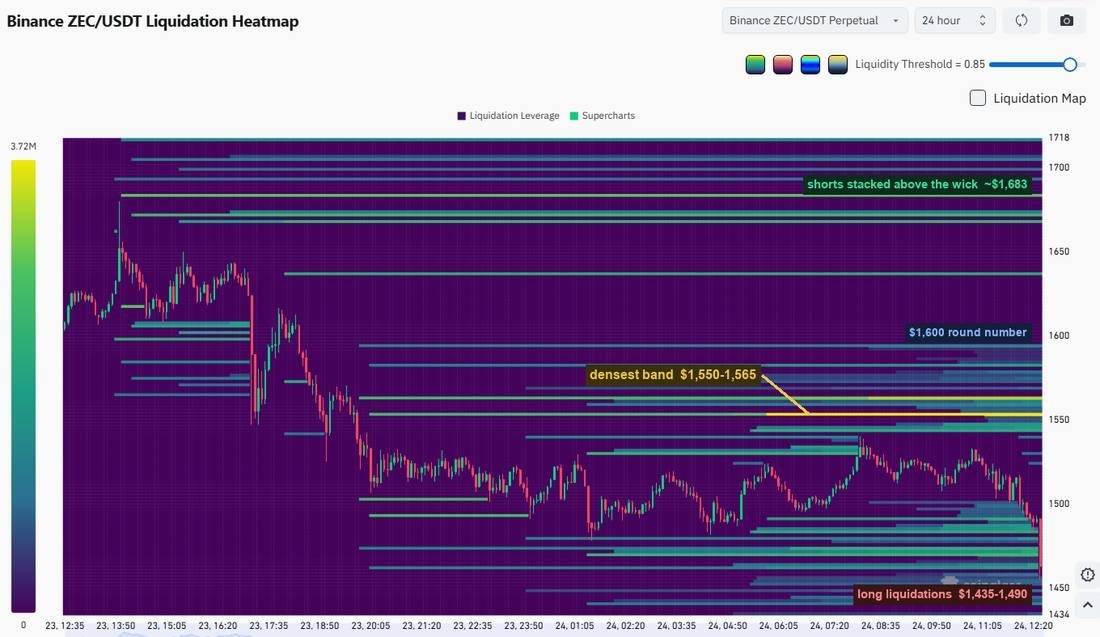
ZEC/USDT liquidation heatmap, Binance perpetuals, 24 hour view. Source: CoinGlass.
Positioning backs up the caution. Binance futures data shows funding at the flat 0.01% baseline, meaning nobody’s paying up to be long, while about 64% of accounts are short. Open interest has slipped from roughly 593,000 ZEC on September 4 to about 446,000, something like $650 million. Price climbed around $450 across that same stretch. Less borrowed money in a rising market usually points to spot buyers doing the work, and the ETF fits that story.
Bulls have one job first. Reclaim $1,550 to $1,565, where the densest liquidation band and the old four-hour block overlap. Get above that, and the $1,572 to $1,595 equal highs come into play, then a second run at $1,680.
Bears want the daily gap. A slide through $1,427 opens the path toward $1,361 and the $1,296 breakout level, with $1,169 as the floor of that gap. A daily close under $1,296 would undo most of September’s structure.
The wider mood isn’t friendly either. Bitcoin holders cashing out near $88K earlier this week didn’t help, and BTC now trades near $83,000. None of this is financial advice, only a read of where structure and liquidity sit, and levels like these can fail fast.
Related News
Explore more