
XRP is seeing a slight pullback, trading at $2.45 at the time of writing, down 0.65% over the last 24 hours. This pullback comes after XRP recently peaked at $2.466 earlier that day on March 25, 2025. The market cap stands at $142.868 billion. However, XRP has seen a drop of 15.38% in the 24-hour trading volume, which stands at $2.778 billion. Throughout this move down, XRP continues to attract the attention of traders. The circulating supply is approximately 58.15 billion, and the total supply is 99.988 billion.
Overall, this indicates that there is room for growth should demand intensify. Furthermore, XRP has a fully diluted market cap of $245.658 billion, indicating the substantial market cap of this token. Can XRP recover from this pullback, or is it for the worse ahead in the days to come?
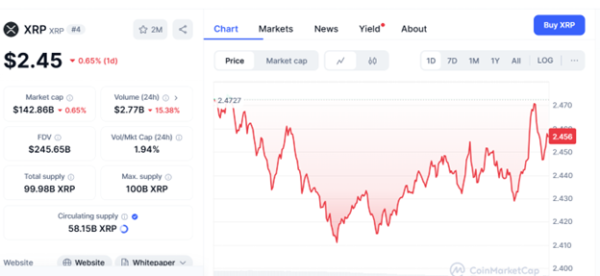
source:coinmarketcap
Technical Setup
According to analyst Vlad on coinmarketcap, a possible breakout above $2.45 is supported with an inverted head and shoulders pattern. The patterns would target $2.60 or $3.00 market prices. The current market sentiment is bullish with 72.28% long positions and trading volume increased by 60.98%. If the price can break above $2.50, it would create a significant rally and trader interest.

Source: TradingView on coinmarketcap
In a recent tweet by CasiTraders on X, XRP is currently forming a tight consolidation on the 4H chart after printing its high at $3.40, setting itself up for a breakout. Fibonacci time analysis and technical analysis indicate the time frames of Time Zone 2 align with the .618 extension, which occurs around March 30th from the $2.70-$3.80 target zone. Key dates in the next month are April 8 for a potential $3.80 high and April 25 at the macro W3 top. June 20th is Time Zone 5, likely representing the overall high for Wave 5. The technicals indicate that an explosive breakout is likely as XRP approaches the apex of its consolidation.
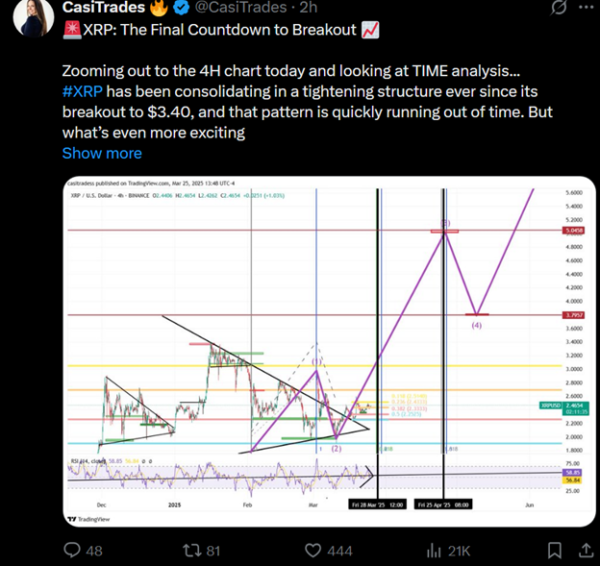
source:X
Technical Indicators: RSI and MACD Signal Caution?
The RSI is at 52.61, showing it is in neutral territory, indicating potential movement either way. The MACD is bearish with a negative histogram value of -0.0240, suggesting that momentum is fading. Traders may want to see the MACD crossover the signal line on the upside for a bullish reversal. Also, the decline in volume on the CoinMarketCap chart suggests buyer interest may be slowly falling, which, if it continues, can accelerate the downtrend if selling picks up.
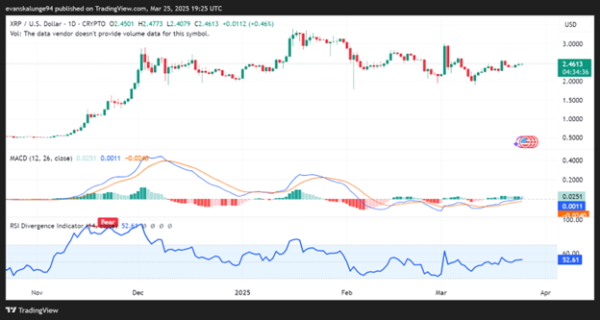
source:TradingView
Liquidations: Are Shorts Pulling XRP Down?
Since November 2024, you can see that short liquidations increase (red bars) when the price takes off, especially in December 2024 and early March 2025, which indicates that bearish traders are being squeezed out. You will also notice that long liquidations are increasing (green bars) as of late February 2025, which corresponded closely with the price declining to the area of $2.45. This indicates possible pressure on the bulls, and this pressure has contributed to the consolidation we have observed. If we have continued long liquidations from the earlier run-up, we might see XRP experience further price declines, particularly in the main support area around $2.42.
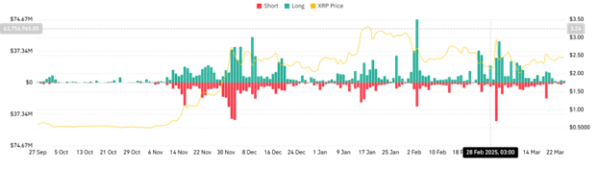
Source:coinglass
Conclusion: Will XRP Recover?
XRP’s pullback to $2.45 reflects a bearish sentiment, mainly influenced by long liquidations and the development of a bearish MACD. Nobody wants to see this kind of action when you think about it, but the historical neutral RSI and support levels are encouraging. If selling continues, XRP may test $2.42, while breaking $2.46 may initiate a rally towards $2.50. Make sure you keep an eye on the volume for confirmation.