- Tron price started a major bearish wave after it failed to clear the $0.0166 resistance against the US Dollar.
- TRX price tested the $0.0135 support zone and it is currently correcting losses.
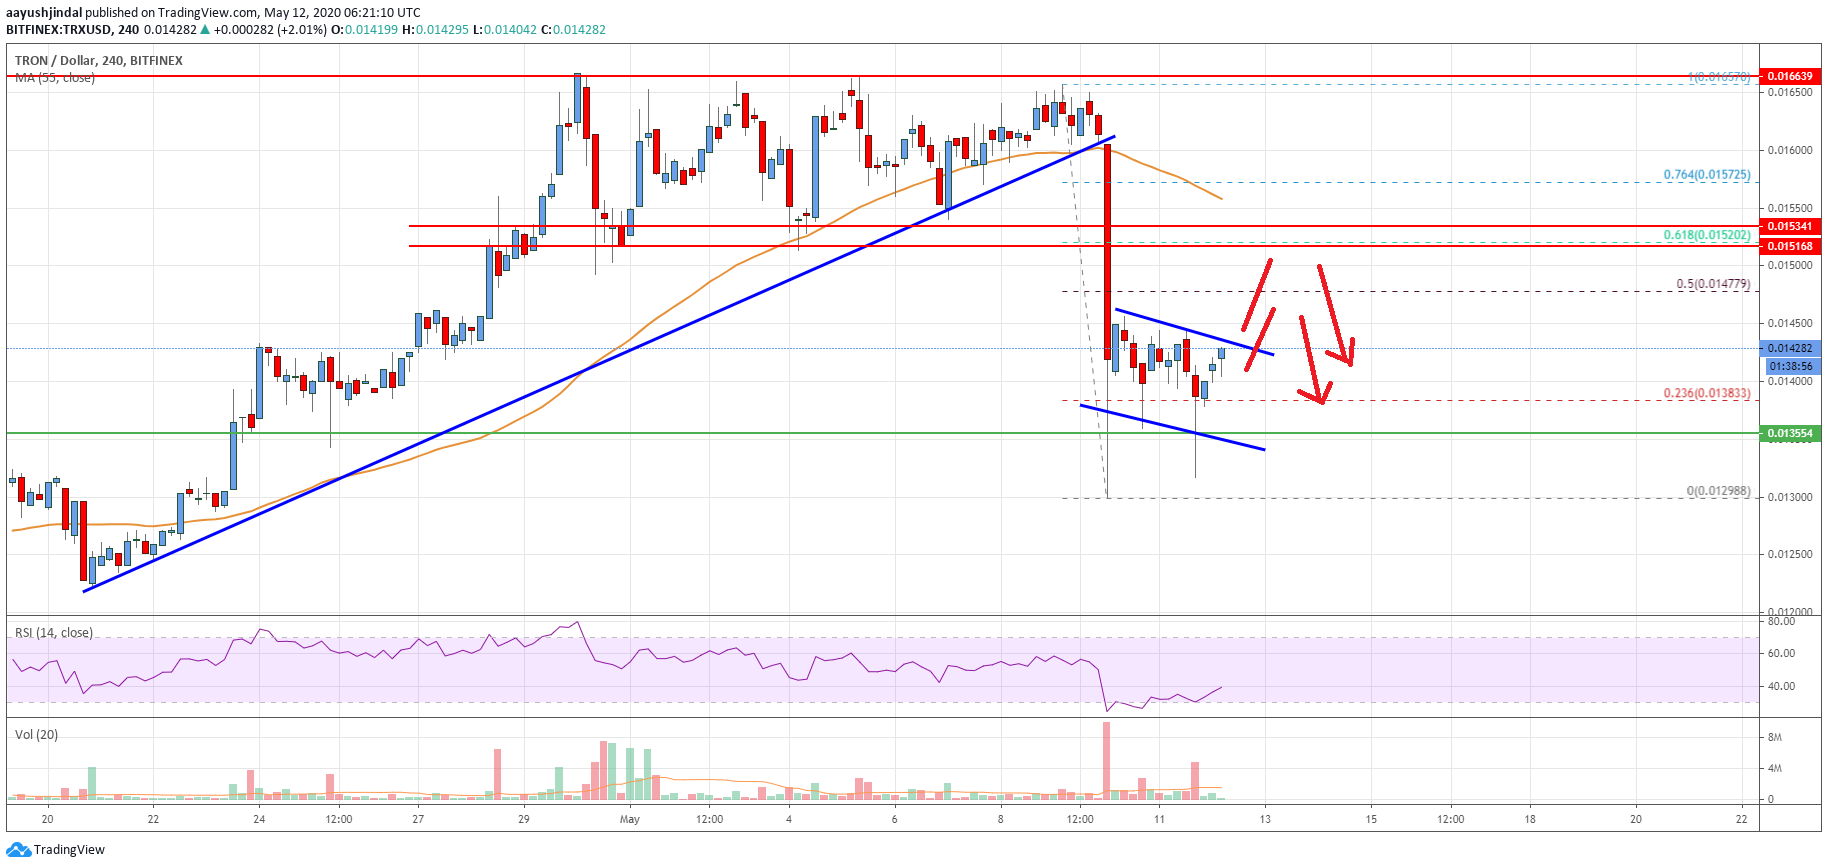
- There was a break below a crucial bullish trend line with support near $0.0160 on the 4-hours chart (data feed via Bitfinex).
- The price could correct higher, but it is likely to face sellers near $0.0150 and $0.0152.
TRON price declined heavily in the past few days against the US Dollar, similar to bitcoin. TRX price is likely to follow a bearish trend as long as it is below the $0.0152 resistance.
Tron Price Analysis
This past week, TRON price struggled to gain bullish momentum above the $0.0165 and $0.0166 resistance levels against the US Dollar. TRX price failed to continue higher and started a strong decline below $0.0160.
To start the decline, there was a break below a crucial bullish trend line with support near $0.0160 on the 4-hours chart. The price broke many key supports near $0.0152 to move into a bearish zone.
There was also a close below the $0.0150 level and the 55 simple moving average (4-hours). The price traded to a new weekly low at $0.0129 and it is currently correcting higher. There was a break above the 23.6% Fibonacci retracement level of the recent decline from the $0.0165 high to $0.0129 low.
It seems like there is a declining channel forming with resistance near the $0.0143 level on the same chart. If there is an upside break above the channel resistance, the price could correct higher towards the $0.0148 level.
The 50% Fibonacci retracement level of the recent decline from the $0.0165 high to $0.0129 low is likely to act as a hurdle near the $0.0148 level. The main resistance on the upside is near the $0.0150 and $0.0152 levels.
To move into a positive zone, tron price must move above the $0.0152 resistance. Conversely, it might fail to recover above the $0.0148 and $0.0150 resistance levels.
On the downside, an initial support is near the $0.0140 level. The main support is near the $0.0135 level, below which the bears are likely to aim a test of $0.0120.
The chart indicates that TRX price is clearly trading in a bearish zone below the $0.0150 level. Therefore, there are chances of more losses below the $0.0140 and $0.0135 support levels.
Technical Indicators
4 hours MACD – The MACD for TRX/USD is likely to move into the bullish zone.
4 hours RSI – The RSI for TRX/USD is currently recovering towards the 45 level.
Key Support Levels – $0.0148 and $0.0150.
Key Resistance Levels – $0.0140, $0.0135 and $0.0120.