- Tron price failed to stay above the $0.0215 support and declined against the US Dollar.
- TRX price is now trading well below $0.0210 and it remains at a risk of more losses.
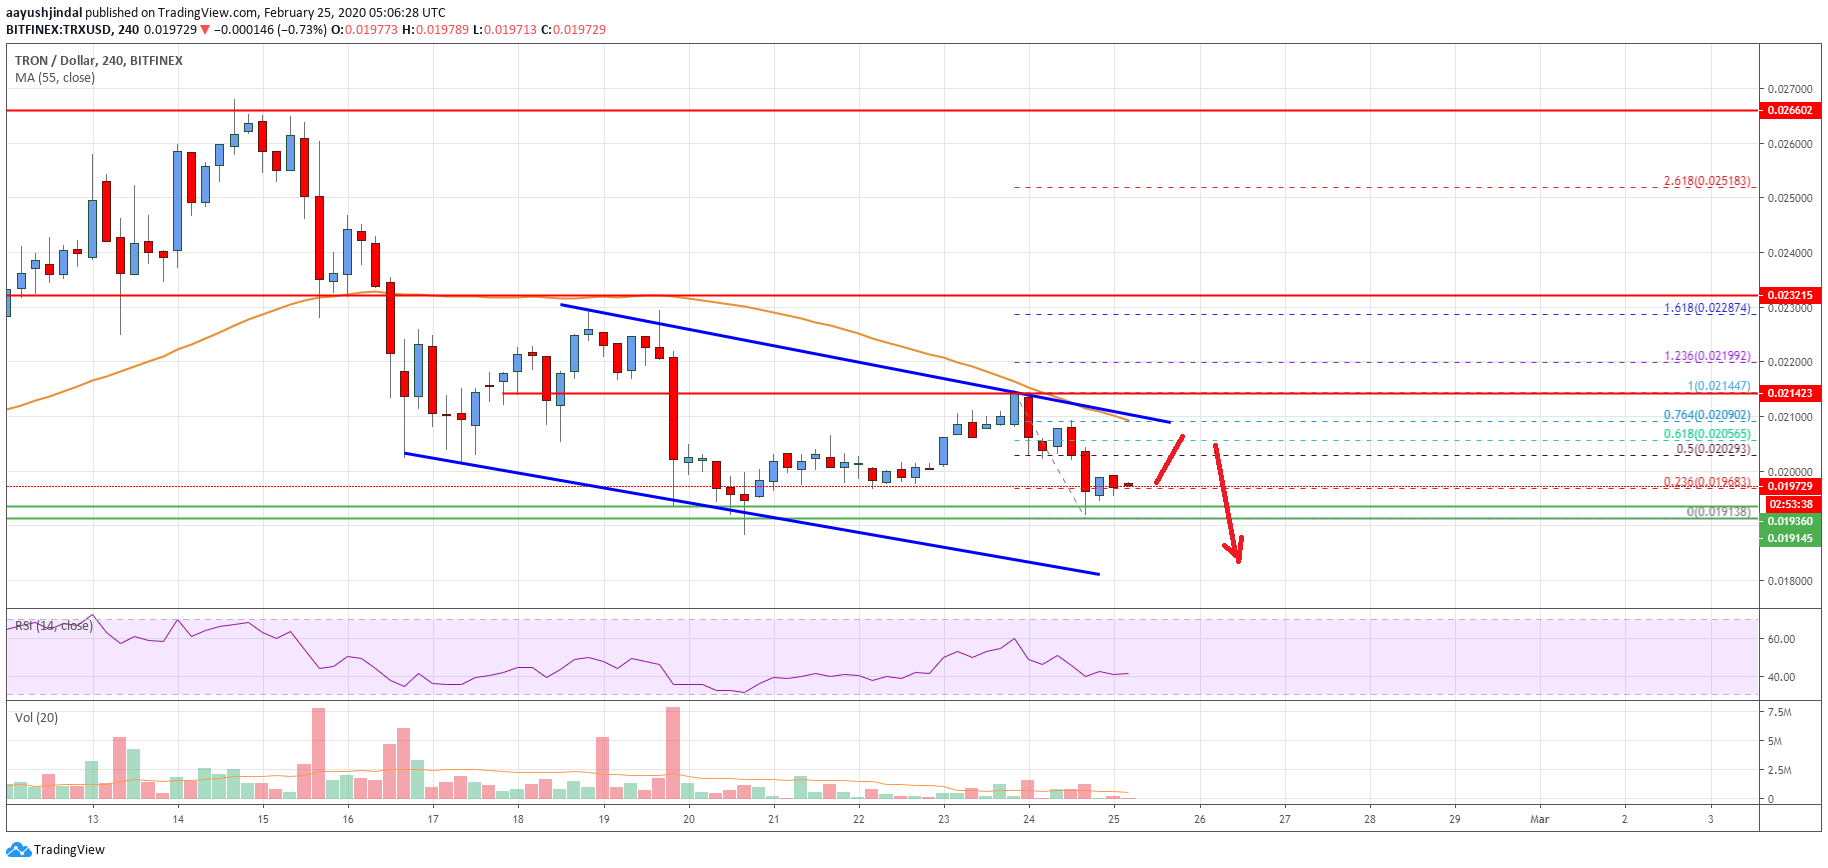
- There is a key declining channel forming with resistance near $0.0208 on the 4-hours chart (data feed via Bitfinex).
- The price could either rally above $0.0208 or decline sharply below $0.0192 in the near term.
TRON price is facing an increase in selling pressure against the US Dollar, similar to bitcoin. TRX price must stay above the $0.0192 and $0.0190 support levels to bounce back.
Tron Price Analysis
In the past few days, there was a steady decline in TRON price from well above the $0.0220 level against the US Dollar. TRX price traded below the key $0.0210 support level and the 55 simple moving average (4-hours) to move into a bearish zone.
Moreover, the price declined below the $0.0200 level and traded close to the $0.0192 support area. A swing low is formed near $0.01913 and the price is currently consolidating losses.
An initial resistance on the upside is near the $0.0202 level. It coincides with the 50% Fibonacci retracement level of the recent decline from the $0.02144 high to $0.01913 low.
More importantly, there is a key declining channel forming with resistance near $0.0208 on the 4-hours chart. It seems like tron price is facing a strong resistance near the $0.0208 area and the 55 simple moving average (4-hours).
The 61.8% Fibonacci retracement level of the recent decline from the $0.02144 high to $0.01913 low is also near the $0.0205 level to act as a hurdle for the bulls.
Therefore, the bulls need to gain pace above the $0.0205 and $0.0208 resistance levels to start a fresh increase in the near term. The next major resistance is near the $0.0215 level, above which the price is likely to continue higher towards the $0.0232 level.
Conversely, the price might decline below the key $0.0191 and $0.0190 support levels. In the mentioned case, there is a risk of a sharp decline towards the $0.0175 and $0.0172 support levels.
The chart indicates that TRX price is clearly trading above a couple of important support levels near $0.0192. If the bulls fail to protect $0.0192 and $0.0190, there could be another slide in the coming sessions.
Technical Indicators
4 hours MACD – The MACD for TRX/USD is slowly gaining momentum in the bearish zone.
4 hours RSI – The RSI for TRX/USD is sliding and it could test the 35 level.
Key Support Levels – $0.0192 and $0.0191.
Key Resistance Levels – $0.0205, $0.0208 and $0.0215.