- Tron price started a fresh decline from well above $0.0300 against the US Dollar.
- TRX price is now trading below the $0.0280 support and the 55 simple moving average (4-hours).
- There was a break below a major contracting triangle with support near $0.0280 on the 4-hours chart (data feed via Bitfinex).
- The pair could continue to move down if it fails to stay above the key $0.0265 support zone.
TRON price started a fresh decline after it failed to stay above $0.0312 against the US Dollar, while bitcoin is well above $27K. TRX price must stay above $0.0265 to avoid more downsides.
Tron Price Analysis
This past week, TRON price made a couple of attempts to settle above $0.0300 against the US Dollar. TRX price failed to gain strength, formed a high near $0.0309, and started a fresh decline.
There was a clear break below the $0.0295 and $0.0290 support levels. There was also a break below a major contracting triangle with support near $0.0280 on the 4-hours chart. The price is now trading below the $0.0280 support and the 55 simple moving average (4-hours).
It even broke the 50% Fib retracement level of the upward move from the $0.0237 swing low to $0.0309 high. On the downside, there is a strong support near the $0.0265 level.
The 61.8% Fib retracement level of the upward move from the $0.0237 swing low to $0.0309 high is also near the $0.0265 level. A clear break below the $0.0265 support may possibly open the doors for more losses. The next major support is near $0.0250, below which tron price may even revisit the $0.0237 low.
On the upside, the price is facing hurdles near the broken triangle zone at $0.0280 and the 55 simple moving average (4-hours). A clear break above the $0.0280 resistance level and the 55 simple moving average (4-hours is needed for a fresh move towards $0.0300. To continue higher, the price must settle above $0.0300.
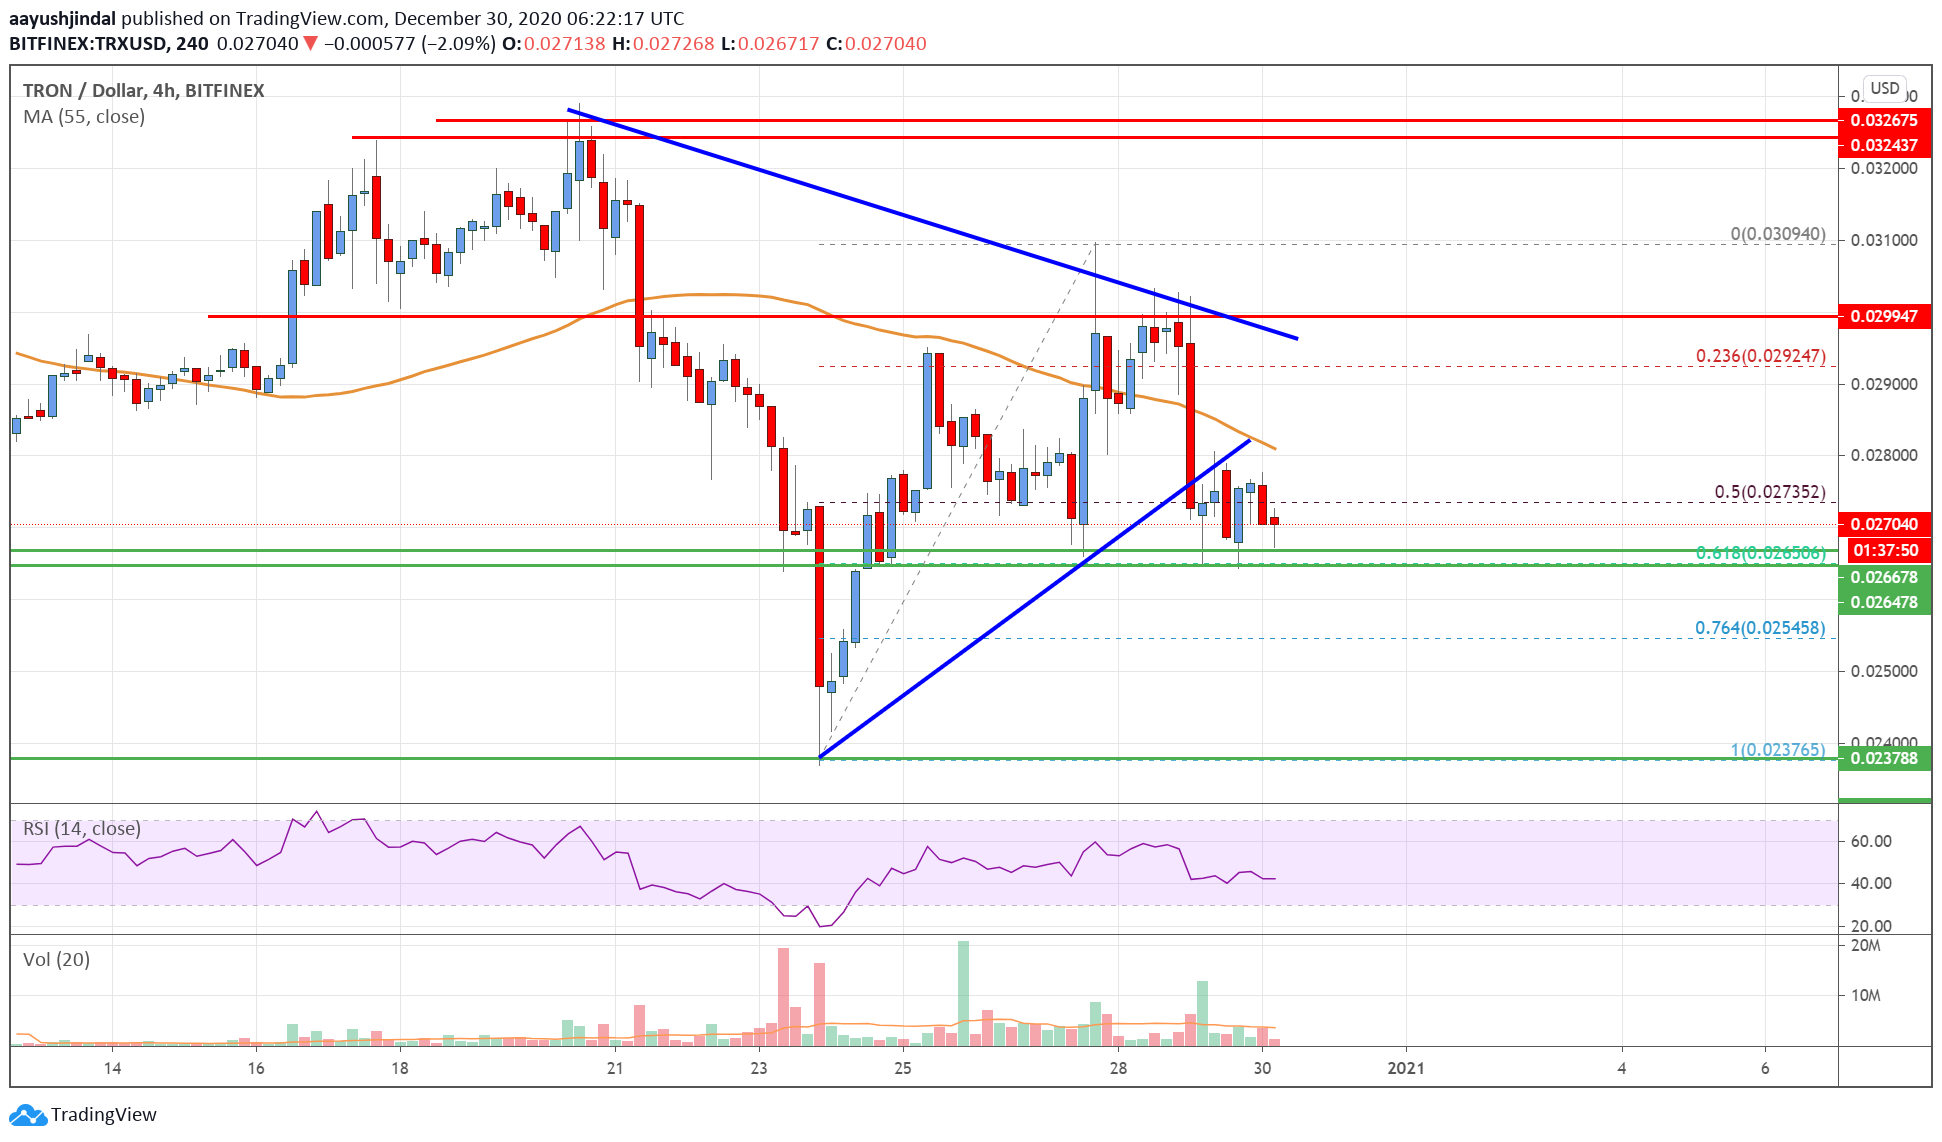
The chart indicates that TRX price clearly trading near a crucial support at $0.0265. Overall, the price could continue to move down if it fails to stay above the key $0.0265 support zone in the near term.
Technical Indicators
4 hours MACD – The MACD for TRX/USD is gaining momentum in the bearish zone.
4 hours RSI – The RSI for TRX/USD is now well below the 50 level.
Key Support Levels – $0.0265 and $0.0250.
Key Resistance Levels – $0.0280, $0.0300 and $0.0320.