- Tron price started a fresh decline from the $0.0960 zone against the US Dollar.
- TRX price is now trading below $0.0880 and the 55 simple moving average (4-hours).
- There was a break below a major bullish trend line with support near $0.0880 on the 4-hours chart (data feed via Bitfinex).
- The pair is likely to continue lower as long as it is below the $0.0880 and $0.0900 levels.
TRON price is slowly moving lower below $0.0900 against the US Dollar, similar to bitcoin. TRX price is likely to continue lower if it clears the $0.0820 support zone.
Tron Price Analysis
After forming a base above the $0.0800 level, tron price extended its increase against the US Dollar. TRX price broke many important hurdles near $0.0880 to move further into a positive zone.
The pair even broke the $0.0950 resistance and the 55 simple moving average (4-hours). However, it failed to test the USD $0.1000 resistance. A high was formed near $0.0969 before the price started a downside correction.
There was a break below the $0.0900 and $0.0850 support levels. A low was formed near $0.0810 before there was a recovery. The price climbed above the 50% Fib retracement level of the key decline from the $0.0969 high to $0.0810 low.
However, the price failed to gain strength above the $0.0900 level. It topped near the 61.8% Fib retracement level of the key decline from the $0.0969 high to $0.0810 low.
It is now moving lower and trading below $0.0880. There was also a break below a major bullish trend line with support near $0.0880 on the 4-hours chart. On the downside, an initial support is near the $0.0820 level. The main support is now forming near $0.0810. Any more losses might call for a sharp decline towards the $0.0720 level.
An initial resistance is near the $0.0865 level. The first major resistance is near the $0.0880 level. The main resistance is near $0.0900. Any more gains could set the pace for a move towards the main $0.1000 resistance zone.
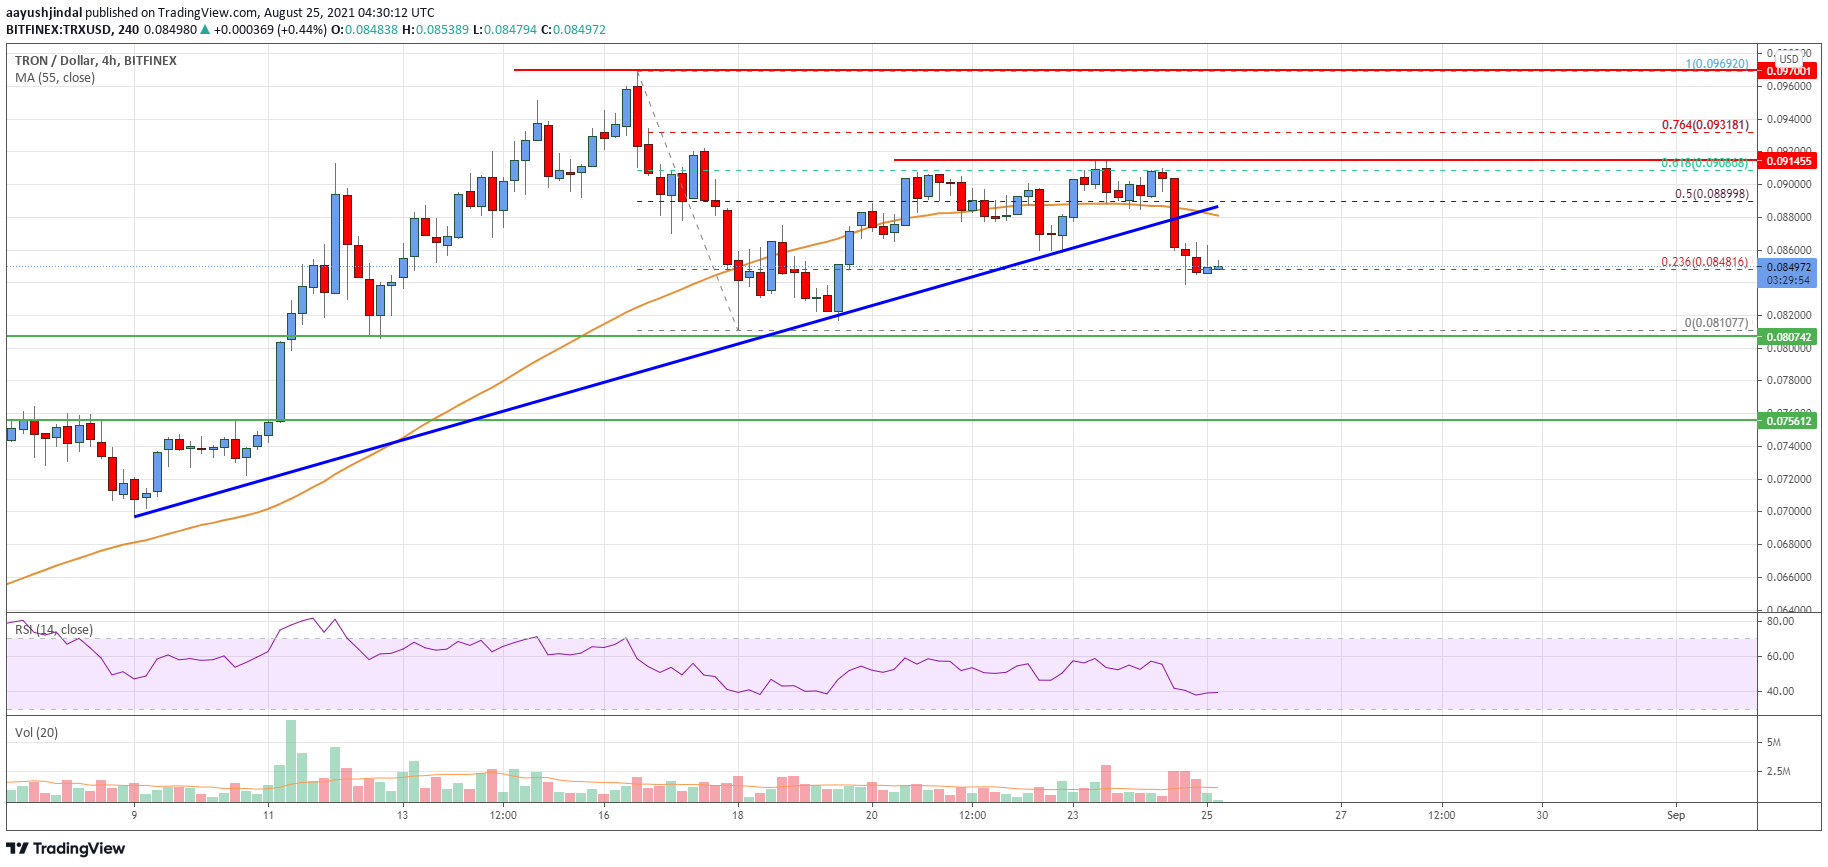
The chart indicates that TRX price is now trading below $0.0880 and the 55 simple moving average (4-hours). Overall, the price is likely to continue lower as long as it is below the $0.0880 and $0.0900 levels.
Technical Indicators
4 hours MACD – The MACD for TRX/USD is now gaining momentum in the bearish zone.
4 hours RSI – The RSI for TRX/USD is now below the 50 level.
Key Support Levels – $0.0820 and $0.0810.
Key Resistance Levels – $0.0865, $0.0880 and $0.0900.