- Tron price is struggling to clear a couple of important resistances near $0.0160 against the US Dollar.
- TRX price is currently trading above the $0.0152 and $0.0150 support levels.
- There is a key bearish trend line forming with resistance near $0.0160 on the 4-hours chart (data feed via Bitfinex).
- The price could start a fresh decline if it fails to surpass $0.0160 and $0.0614.
TRON price is currently consolidating below key resistances against the US Dollar and bitcoin. TRX price must break the $0.0160 resistance area to climb towards $0.0184 and $0.0200.
Tron Price Analysis
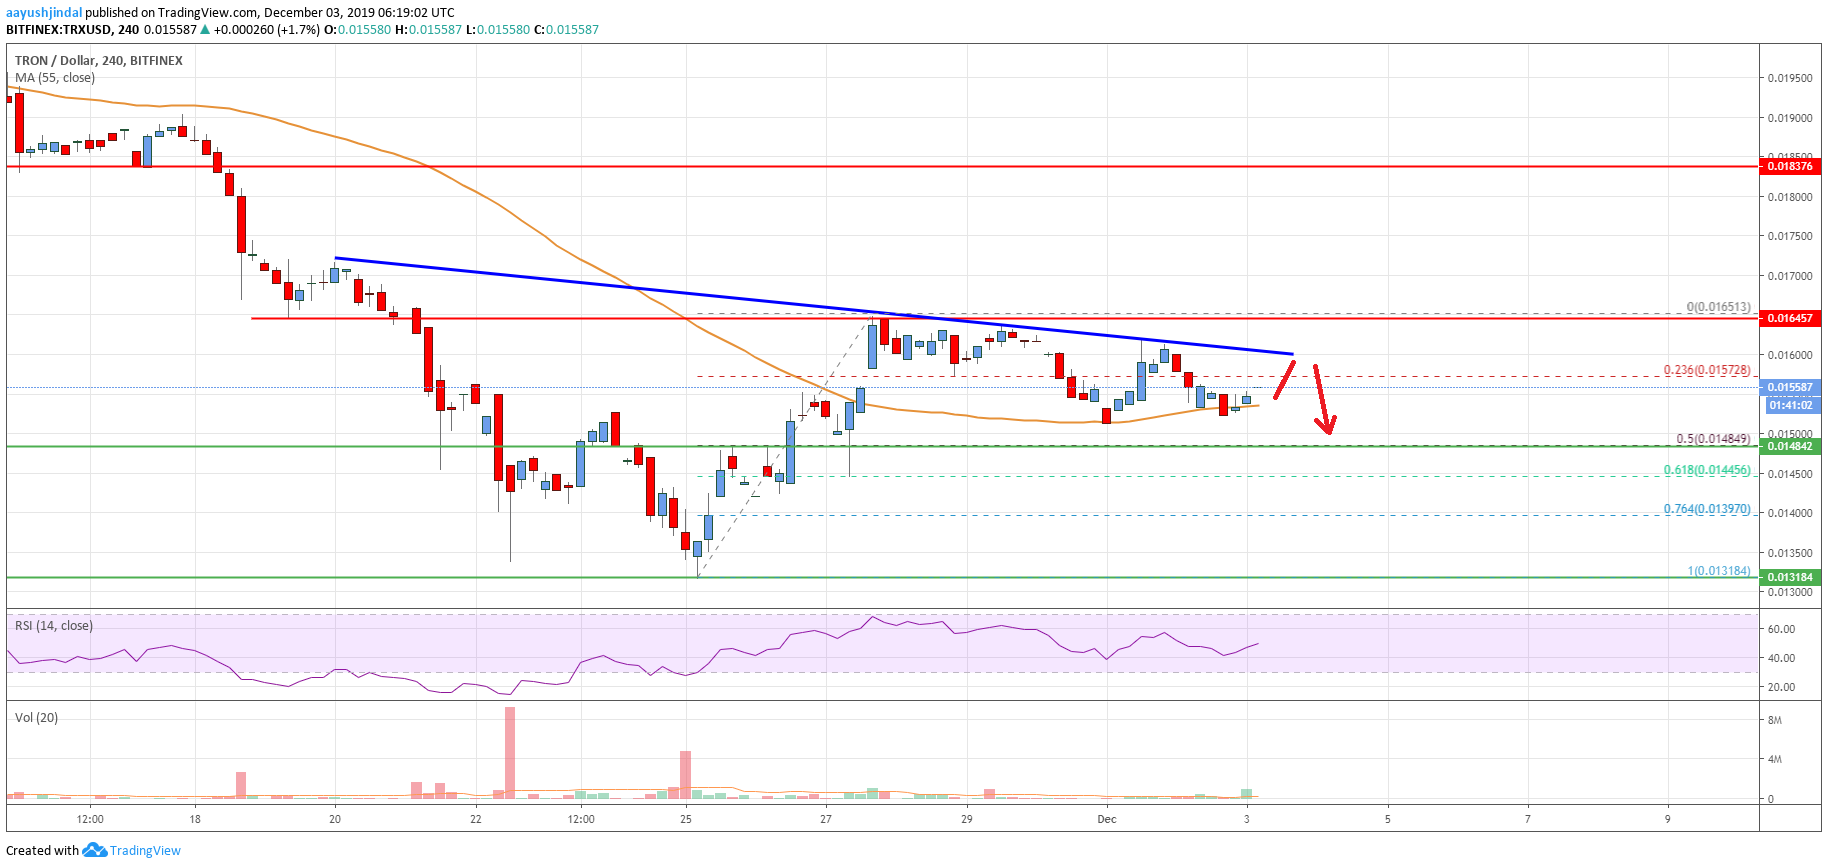
After a strong decline, TRON price found support near the $0.0132 level against the US Dollar. Later, TRX price started an upside correction and traded above the $0.0148 resistance area.
Moreover, there was a break above the $0.0155 resistance and the 55 simple moving average (4-hours). Finally, the price traded above the $0.0160 and $0.0162 resistance levels.
However, the bulls struggled to clear the $0.0165 resistance area. A high was formed near $0.0165 and the price is currently trimming gains. It traded below the 23.6% Fibonacci retracement level of the upward move from the $0.0131 low to $0.0165 high.
Tron price is currently trading near the $0.0155 level and the 55 simple moving average (4-hours). An immediate support on the downside is near the $0.0150 level.
The main support is near the $0.0148 level. Additionally, the 50% Fibonacci retracement level of the upward move from the $0.0131 low to $0.0165 high is also near $0.0148.
Therefore, a downside break below the $0.0148 support area could start a strong decline. The next support is near the $0.0140 level, below which the doors could open for a test of the $0.0132 swing low.
On the upside, there are many resistances, starting with the $0.0160 level. Besides, there is a key bearish trend line forming with resistance near $0.0160 on the 4-hours chart.
If there is an upside break above the trend line resistance, the price could test the $0.0165 resistance area. Any further gains will most likely lead the price towards the $0.0185 resistance area.
The chart indicates that TRX price is losing pace below the $0.0160 resistance area. Thus, there is a risk of a downside break below the $0.0150 and $0.0148 support levels. Conversely, a close above $0.0160 is needed for a push above $0.0165 in the near term.
Technical Indicators
4 hours MACD – The MACD for TRX/USD is losing momentum in the bearish zone.
4 hours RSI – The RSI for TRX/USD is currently rising and heading towards the 50 level.
Key Support Levels – $0.0150 and $0.0148.
Key Resistance Levels – $0.0160, $0.0165 and $0.0185.