- Tron price started a downside correction from the $0.0190 zone against the US Dollar.
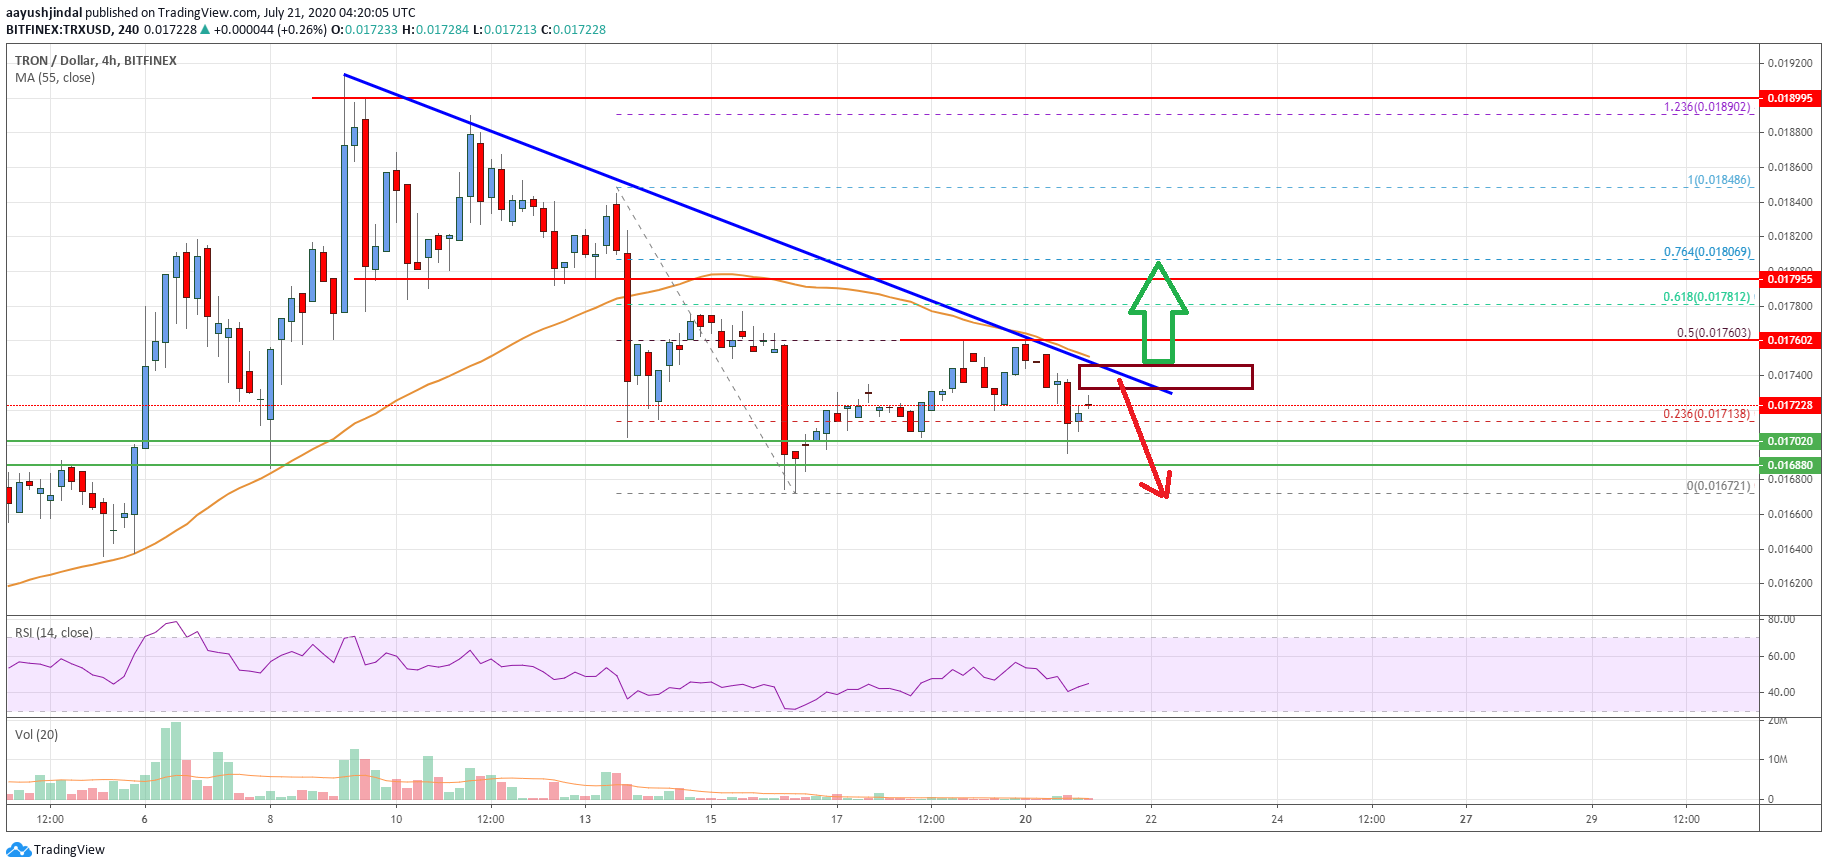
- TRX price declined below $0.0180 and it is currently trading near the $0.0172 support zone.
- There is a crucial contracting triangle forming with resistance near $0.0181 on the 4-hours chart (data feed via Bitfinex).
- The pair could start a strong downward move if it breaks the $0.0172 and $0.0170 support levels.
TRON price is trading near a major support zone against the US Dollar, similar to bitcoin. TRX price must stay above $0.0170 to start a fresh increase in the near term.
Tron Price Analysis
This past week, TRON price extended its rise towards the $0.0200 level against the US Dollar. However, TRX price faced a strong selling interest near the $0.0190 zone and it settled above the 55 simple moving average (4-hours).
A high was formed near $0.0190 and the price started a steady decline. It traded below the $0.0180 support level. The last swing high was formed near $0.0184 before the price traded below the $0.0175 level and the 55 simple moving average (4-hours).
The price is now trading near the main uptrend support at $0.0172. An initial resistance is near the $0.0177 level or the 50% Fibonacci retracement level of the recent decline from the $0.0184 high to $0.0170 low.
It seems like there is a crucial contracting triangle forming with resistance near $0.0181 on the 4-hours chart. TRX price is clearly facing a strong resistance near the $0.0180 level and the 55 simple moving average (4-hours). The 61.8% Fibonacci retracement level of the recent decline from the $0.0184 high to $0.0170 low is also near $0.01795.
Therefore, the bulls need to gain strength above the $0.0178, $0.0180 and $0.0182 resistance levels to initiate a fresh increase. In this case, the price could break $0.0190 and continue higher towards the $0.0200 barrier in the near term.

The chart indicates that TRX price is clearly trading near a couple of important support at $0.0172 and $0.0170. If it fails to recover above $0.0178, there is a risk of a sharp decline below $0.0170. The next major support below $0.0170 is seen near the $0.0162 level.
Technical Indicators
4 hours MACD – The MACD for TRX/USD is currently gaining momentum in the bearish zone.
4 hours RSI – The RSI for TRX/USD is now below the 40 level, with a bearish angle.
Key Support Levels – $0.0172 and $0.0170.
Key Resistance Levels – $0.0178, $0.0180 and $0.0182.


