- Tron price followed a decent bullish path and climbed above the $0.0180 resistance against the US Dollar.
- TRX price tested the $0.0200 resistance area and it is currently correcting lower.
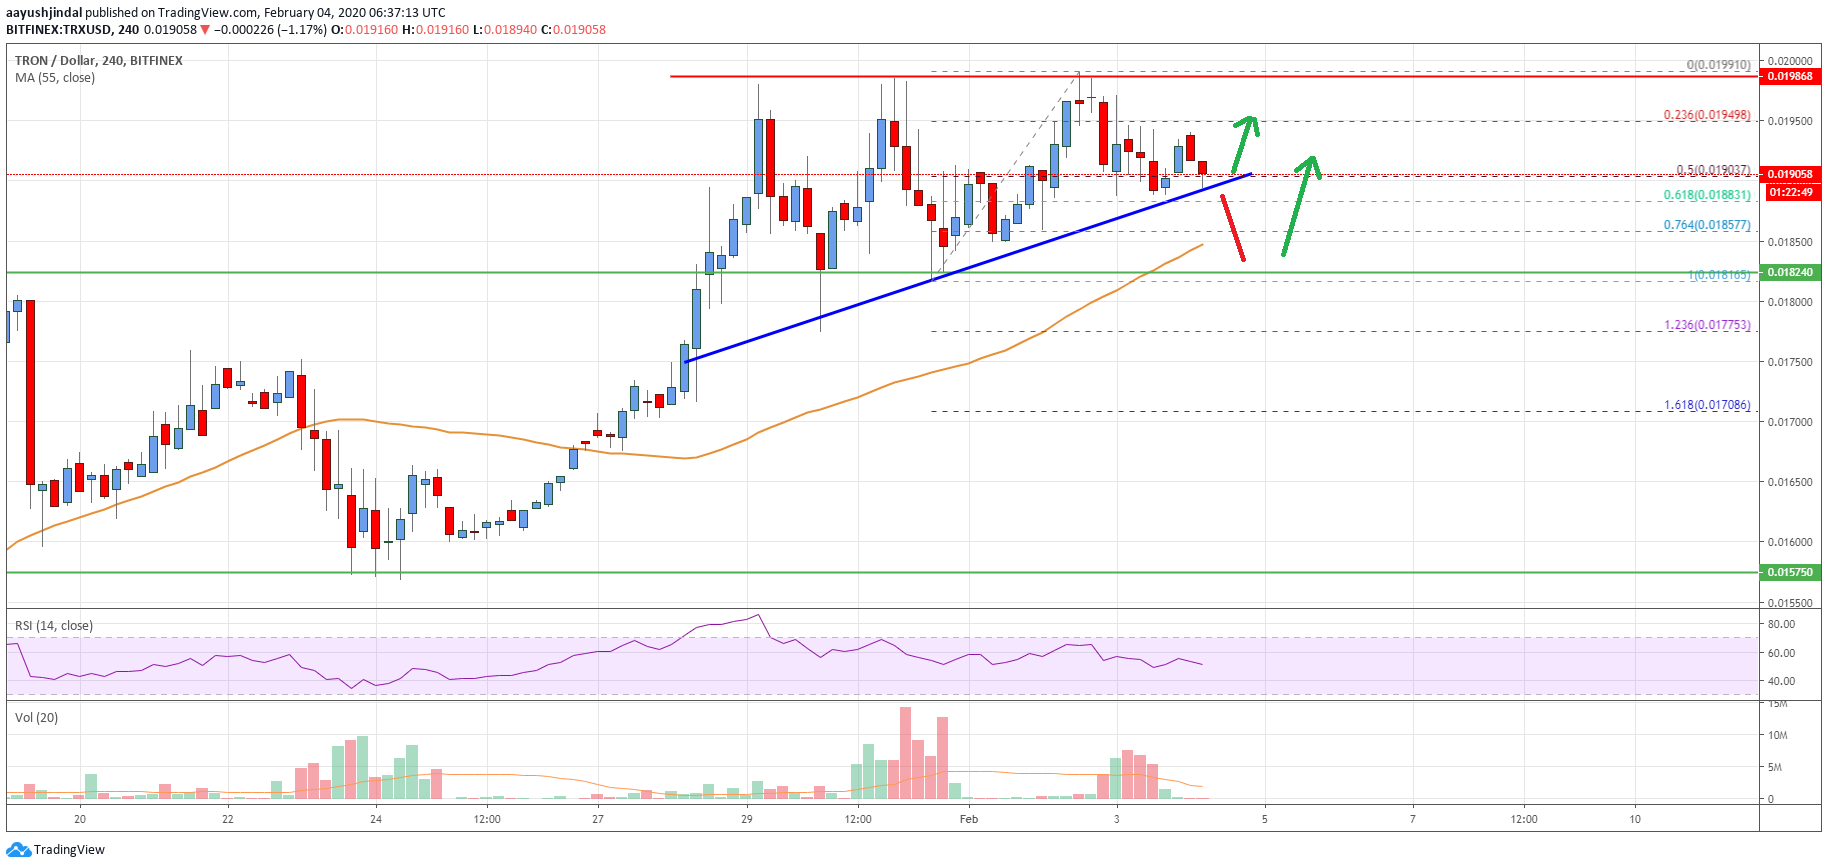
- There is a key bullish trend line forming with support near $0.0189 on the 4-hours chart (data feed via Bitfinex).
- The bulls are likely to remain in action as long as the price is above the $0.0180 support.
TRON price is following a strong uptrend against the US Dollar, similar to bitcoin. TRX price remains well supported above the $0.0182 and $0.0180 levels in the near term.
Tron Price Analysis
In the past few days, there were steady gains in TRON price above the $0.0170 pivot level against the US Dollar. TRX price broke the key $0.0180 resistance level and the 55 simple moving average (4-hours).
It opened the doors for more gains above the $0.0188 and $0.0190 levels. Finally, the price tested the $0.0200 resistance area and a high is formed near the $0.0199 level.
Tron price is currently correcting lower below $0.0195 level. It broke the 23.6% Fibonacci retracement level of the upward move from the $0.0181 low to $0.0199 high. However, there are many support on the downside, starting with $0.0190.
Moreover, there is a key bullish trend line forming with support near $0.0189 on the 4-hours chart. The trend line is close to the 50% Fibonacci retracement level of the upward move from the $0.0181 low to $0.0199 high.
If there is a downside break below the trend line, the price could correct lower towards the $0.0185 support level. Besides, the 55 simple moving average (4-hours) is also near the $0.0185 level to provide support.
Any further losses may perhaps lead the price towards the $0.0182 support level. The last line of defense is near the $0.0180 level, below which there is a risk of a breakdown towards the $0.0170 level.
On the upside, the $0.0195 level is an initial resistance for the bulls. The main hurdle for the bulls is near the $0.0200 level. A successful break above the $0.0200 resistance area might set the pace for a larger rally towards $0.0220.

The chart indicates that TRX price is clearly trading in a nice uptrend above $0.0182 and $0.0185. As long as there is no close below the $0.0180 support, there are chances of a decent increase in the coming sessions.
Technical Indicators
4 hours MACD – The MACD for TRX/USD is slowly losing momentum in the bullish zone.
4 hours RSI – The RSI for TRX/USD is currently just above the 50 level.
Key Support Levels – $0.0185 and $0.0182.
Key Resistance Levels – $0.0195, $0.0200 and $0.0220.


