- Tron price is rising and trading above the $0.0140 resistance level against the US Dollar.
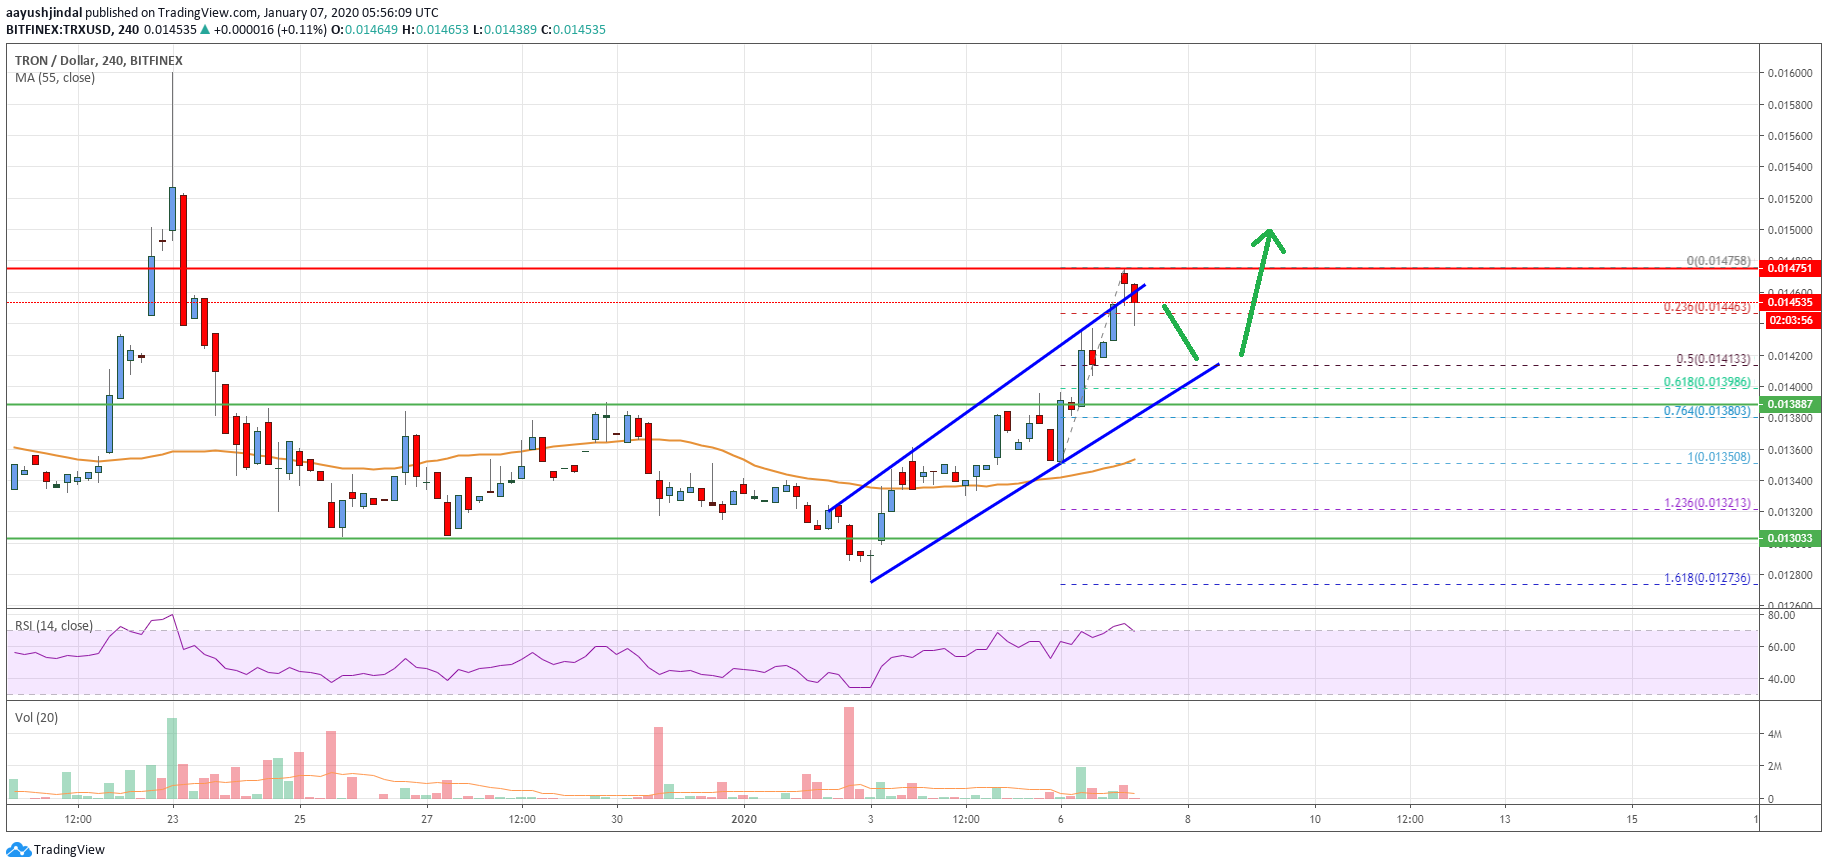
- TRX price is currently trading near a key resistance area at $0.0148.
- There is an ascending channel in place with resistance support near $0.0141 on the 4-hours chart (data feed via Bitfinex).
- The bulls are likely eyeing a clear break above the $0.0148 and $0.0150 resistance levels.
TRON price is showing a lot of positive signs against the US Dollar, similar to bitcoin. TRX price must climb above $0.0150 to continue higher towards $0.0165.
Tron Price Analysis
After forming a support base near $0.0130, TRON price started a decent recovery against the US Dollar. TRX price broke the $0.0135 and $0.0140 resistance levels to enter a positive zone.
Moreover, there was a close above the $0.0140 level and the 55 simple moving average (4-hours). The price is now trading above the $0.0145 resistance and testing the $0.0148 resistance.
If there is a clear break above the $0.0148 resistance, tron price might even surpass the $0.0150 resistance area. In the mentioned case, the price could start a steady rise towards the $0.0162 and $0.0165 resistance levels.
Any further gains may perhaps lead the price towards the $0.0180 resistance area. Conversely, the price could fail to break the $0.0148 and $0.0150 resistance levels.
In the mentioned bearish case, the price could retreat from $0.0148. An initial support is near the 23.6% Fibonacci retracement level of the upward move from the $0.0135 low to $0.0147 swing high.
The main support is seen near the $0.0145 level. It coincides with the 50% Fibonacci retracement level of the upward move from the $0.0135 low to $0.0147 swing high. Moreover, there is an ascending channel in place with resistance support near $0.0141 on the 4-hours chart.
If there is a downside break below the $0.0141 and $0.0140 support levels, the price might revisit the key $0.0130 support level. Any further losses is likely to start a strong decline towards the $0.0120 and $0.0110 levels in the near term.
The chart indicates that TRX price is showing a few positive and breakout signs above the $0.0145 levels. Once the bulls gain pace above the $0.0148 and $0.0150 levels, the price is likely to continue higher towards $0.0165 or $0.0170.
Technical Indicators
4 hours MACD – The MACD for TRX/USD is gaining pace in the bullish zone.
4 hours RSI – The RSI for TRX/USD is currently correcting lower from the 70 level.
Key Support Levels – $0.0145 and $0.0140.
Key Resistance Levels – $0.0148, $0.0150 and $0.0165.