- Tron price is currently rising and it is trading above the $0.0100 resistance against the US Dollar.
- TRX price is likely to surge if there is an upside break above the $0.0120 resistance.
- There is a key bearish trend line forming with resistance near $0.0115 on the 4-hours chart (data feed via Bitfinex).
- The price could dip a few points, but it is likely to find support near the $0.0105 level.
TRON price is showing a few positive and recovery signs against the US Dollar, similar to bitcoin. TRX price is likely to gain bullish momentum if it clears the $0.0120 resistance.
Tron Price Analysis
In the past few days, there was a decent recovery in TRON price above the $0.0950 resistance against the US Dollar. TRX price traded above the $0.0100 resistance area and the 55 simple moving average (4-hours).
The price even gathered pace above the $0.0120 level and traded as high as $0.0127. Recently, there was a downside correction below $0.0110. The price traded below the 50% Fibonacci retracement level of the upward move from the $0.0085 low to $0.0127 high.
However, the decline was protected by the $0.0105 support area. The 61.8% Fibonacci retracement level of the upward move from the $0.0085 low to $0.0127 high is also acting as a support.
The price is now rising and trading above the $0.0114 level. An initial resistance is near the $0.0115 level. There is also a key bearish trend line forming with resistance near $0.0115 on the 4-hours chart.
If there is an upside break above the trend line, the price could rise further above $0.0118. The main resistance is near the $0.0120 level, above which the bulls are likely to aim a strong surge.
Conversely, the price might start another downside correction from $0.0115. An initial support is near the $0.0105 level. The main support is near the $0.0100 level, below which the price is likely to accelerate lower towards the $0.0085 level in the coming sessions.
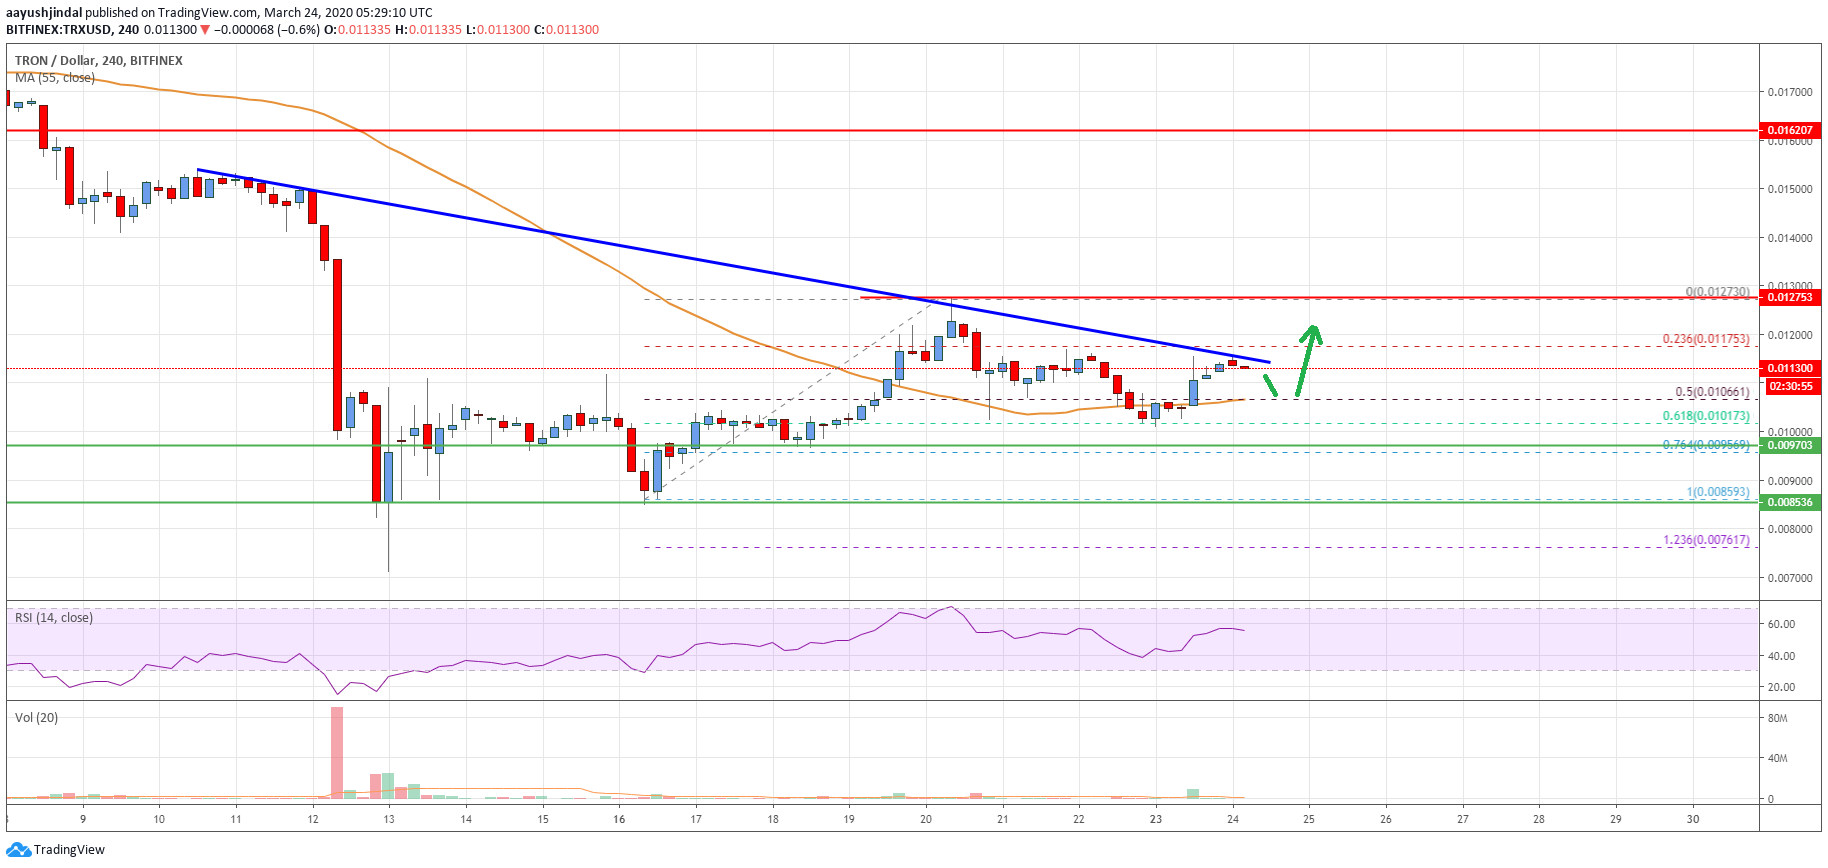
The chart indicates that TRX price is clearly trading in a bullish zone above the $0.0112 level. However, the bulls need to gain pace above the $0.0115 and $0.0120 levels to start a strong upward move.
Technical Indicators
4 hours MACD – The MACD for TRX/USD is slowly gaining momentum in the bullish zone.
4 hours RSI – The RSI for TRX/USD is rising and it is now well above the 50 level.
Key Support Levels – $0.0100 and $0.0085.
Key Resistance Levels – $0.0115, $0.0120 and $0.0135.