- Stellar lumen price topped near the $0.0888 area and declined heavily against the US Dollar.
- XLM price broke a few key supports near $0.0800 to enter a bearish zone.
- There was a break below a major bullish trend line with support near $0.0752 on the 4-hours chart (data feed via Kraken).
- The pair even broke the $0.0700 support area and it is currently consolidating losses.
Stellar lumen price is trading in a bearish zone against the US Dollar and bitcoin. XLM could continue to move down if it fails to recover back above $0.0780.
Stellar Lumen Price Analysis (XLM to USD)
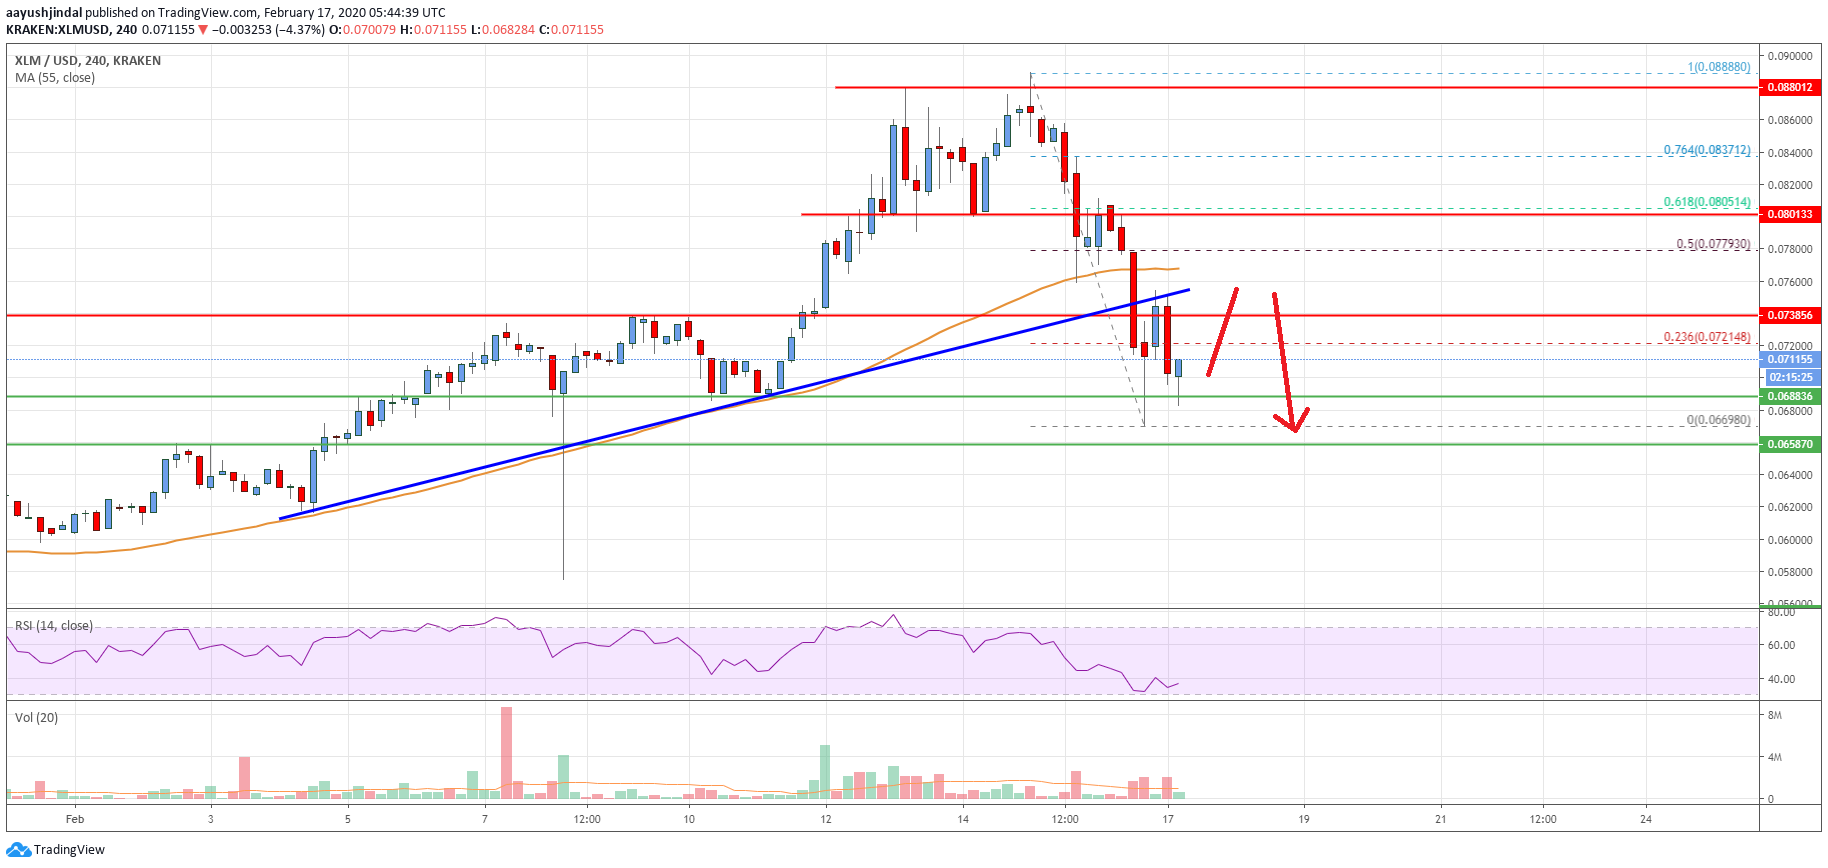
After a strong upward move, stellar lumen price failed to continue higher above the $0.0888 level against the US Dollar. The XLM/USD pair formed a short term top and recently started a sharp decline below $0.0800.
There was a break below the $0.0780 support area and the 55 simple moving average (4-hours). It opened the doors for more losses and the price even broke the $0.0700 support area.
A swing low is formed near $0.0669 and the price is currently consolidating losses. An initial resistance is near the $0.0720 level. It coincides with the 23.6% Fibonacci retracement level of the recent decline from the $0.0888 high to $0.0669 low.
Besides, the broken bullish trend line might act as a key hurdle for the bulls near the $0.0750 level. The next resistance is seen near the $0.0760 level and the 55 simple moving average (4-hours).
To move into a positive zone, stellar price must move back above the $0.0780 and $0.0800 resistance levels. The 50% Fibonacci retracement level of the recent decline from the $0.0888 high to $0.0669 low is also near the $0.0780 level.
If not, the price is likely to continue lower below the $0.0700 and $0.0680 levels. On the downside, the first key support is seen near the $0.0650 level. If the bulls fail to defend the $0.0650 support, there is a risk of a larger decline below the $0.0620 support area in the near term.
The chart indicates that XLM price is back in a negative zone below the $0.0750 level. If there is a clear break below the $0.0650, the bears are likely to take control. They might even target a test of the $0.0600 zone in the coming sessions.
Technical Indicators
4 hours MACD – The MACD for XLM/USD is currently losing momentum in the bearish zone.
4 hours RSI – The RSI for XLM/USD is now well below the 50 level.
Key Support Levels – $0.0680 and $0.0650.
Key Resistance Levels – $0.0760, $0.0780 and $0.0800.