- Stellar lumen price is showing a lot of positive signs above $0.1000 against the US Dollar.
- XLM price tested the $0.1120 resistance zone and it is now well above the 55 simple moving average (4-hours).
- There is a major contracting triangle forming with resistance near $0.1090 on the 4-hours chart (data feed via Kraken).
- The pair could correct a few points, but dips are likely to be limited below $0.1000 and $0.0980.
Stellar lumen price is trading in a bullish zone above $0.1000 against the US Dollar, similar to bitcoin above $18K. XLM price is likely to continue higher above $0.1120 and $0.1150.
Stellar Lumen Price Analysis (XLM to USD)
In the past few days, stellar lumen price gained pace above the $0.0880 and $0.0900 against the US Dollar. The XLM/USD pair even surged above the $0.1000 resistance and settled well above the 55 simple moving average (4-hours).
Finally, there was a break above $0.1100 before the price faced hurdles near $0.1150. There was a downside correction below the $0.1050 level, but the bulls were able to protect the $0.1000 level. A swing low was formed near $0.0965 and the price is currently rising.
The recent swing high was near $0.1098. An initial support is forming near the $0.1030 level since it is close to the 50% Fibonacci retracement level of the recent wave from the $0.0965 low to $0.1098 high.
There is also a major contracting triangle forming with resistance near $0.1090 on the 4-hours chart. The triangle support is close to the 61.8% Fibonacci retracement level of the recent wave from the $0.0965 low to $0.1098 high.
If there is upside break above the $0.1080 and $0.1100 resistance levels, the price could continue to grind higher. The next major resistance is near $0.1120, above which the price might rally towards the $0.1200 level.
Conversely, there is a risk of a fresh decline below the triangle support and $0.1020. An initial support is near the $0.1000 level, below which the price could dive towards the $0.0850 support.
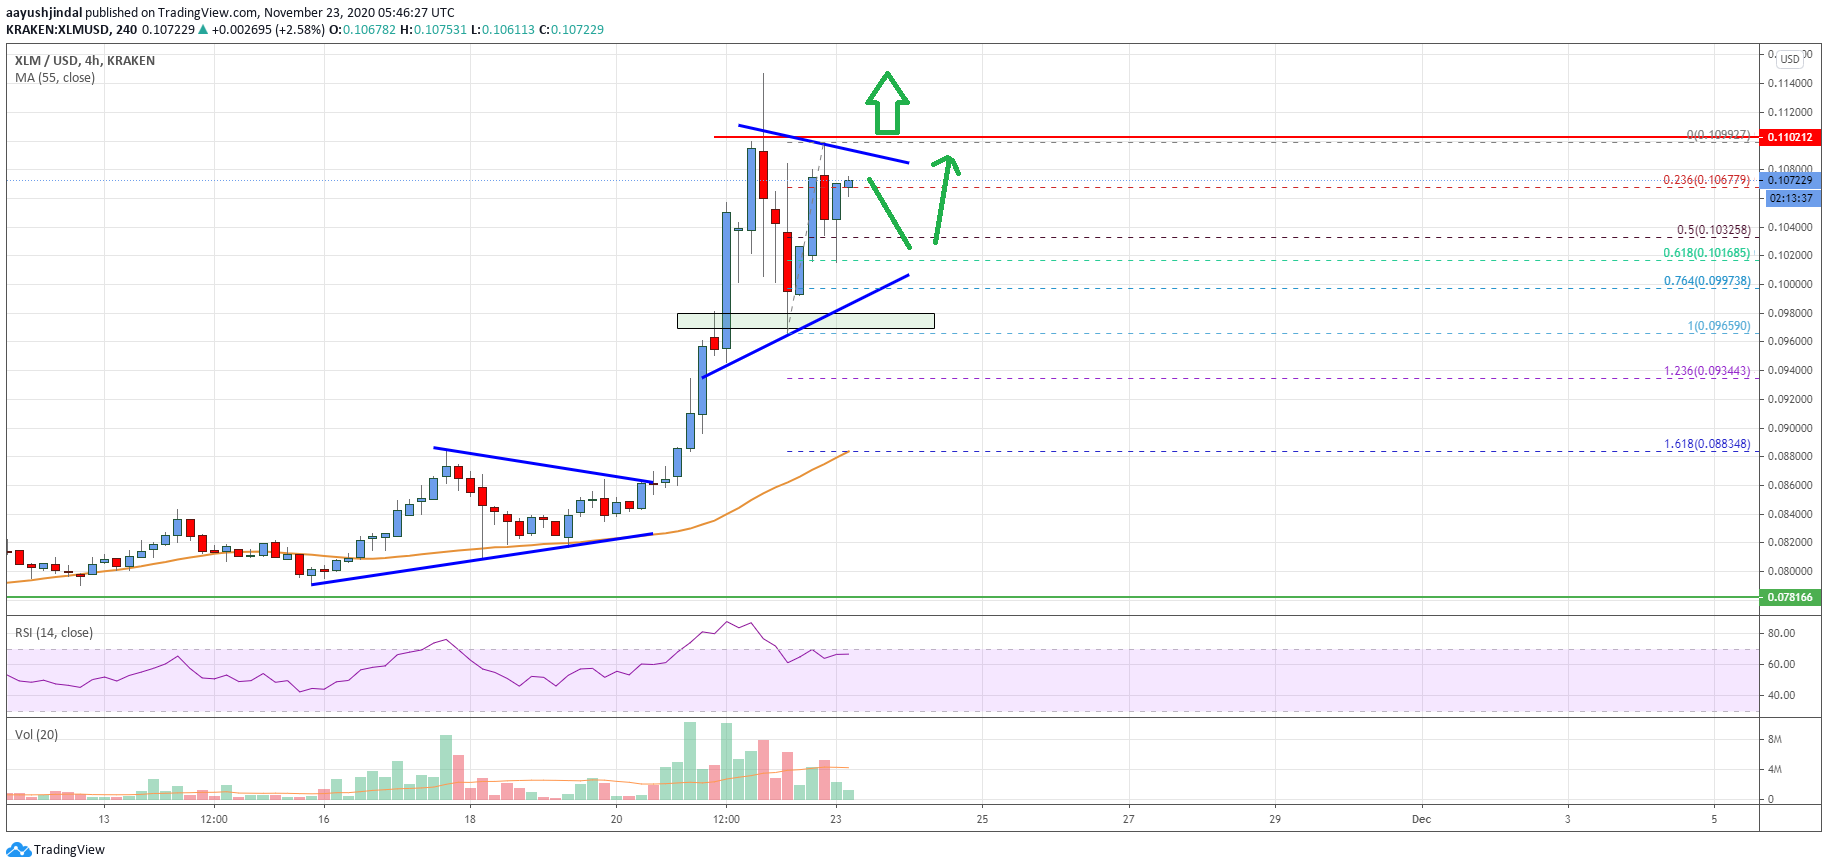
The chart indicates that XLM price is clearly showing positive signs above $0.1000 and the 55 simple moving average (4-hours). Overall, the price could correct a few points, but dips are likely to be limited below $0.1000 and $0.0980.
Technical Indicators
4 hours MACD – The MACD for XLM/USD is showing positive signs in the bullish zone.
4 hours RSI – The RSI for XLM/USD is now well above the 50 level.
Key Support Levels – $0.1000 and $0.0880.
Key Resistance Levels – $0.1080, $0.1120 and $0.1200.