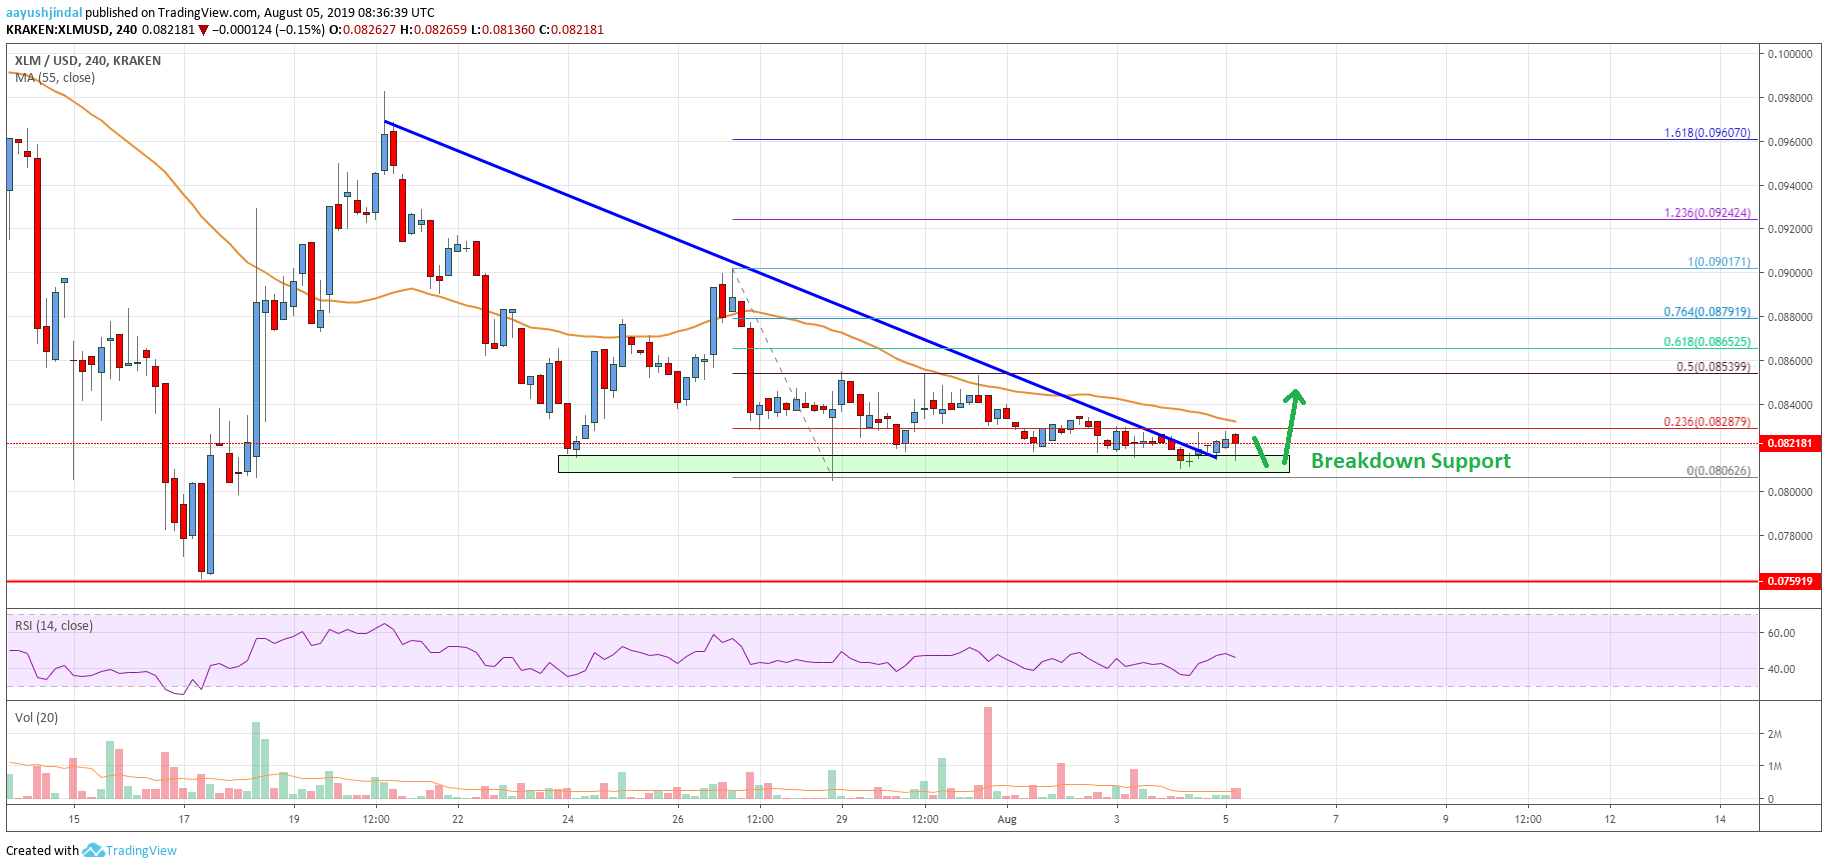
- Stellar lumen price is holding an important support near $0.0800 against the US Dollar.
- XLM price could start to recover towards the $0.0850 and $0.0900 resistance levels.
- There was a break above a crucial bearish trend line with resistance near $0.0818 on the 4-hours chart (data feed via Kraken).
- The pair could slowly recover unless the bulls fail to defend the key $0.0800 support area.
Stellar lumen price is trading above a few important supports against the US Dollar. XLM price might recover towards the $0.0900 level in the coming sessions.
Stellar Lumen Price Analysis (XLM to USD)
This past week, stellar lumen price remained under pressure below $0.0850 against the US Dollar. The XLM/USD pair made a couple of attempts to break the key $0.0810 and $0.0800 support levels. However, the bears failed to gain traction and a swing low was formed near $0.0806. The price is currently consolidating above the $0.0800 support level and it seems like there could be a decent rise.
Recently, there was a break above a crucial bearish trend line with resistance near $0.0818 on the 4-hours chart. An immediate resistance is near the $0.0830 level and the 55 simple moving average (4-hours). Moreover, the 23.6% Fibonacci retracement level of the downward move from the $0.0901 high to $0.0806 low might prevent gains. If there is an upside break above $0.0830, the price could recover further.
The next key resistance is near the $0.0850 level. Additionally, the 50% Fibonacci retracement level of the downward move from the $0.0901 high to $0.0806 low is near the $0.0853. Any further gains above $0.0850 will most likely open the gates for a move towards the $0.0900 resistance. The next stop could be near the $0.0924 level. It represents the 1.236 Fib extension level of the downward move from the $0.0901 high to $0.0806 low.
Conversely, if there is no bullish break above $0.0830 and $0.0850, the price could decline heavily. A successful break below the $0.0800 support level might start a strong decline towards the $0.0750 support. An intermediate support is near the $0.0780 level.
The chart indicates that XLM price is clearly holding an important support near $0.0800. Therefore, as long as the price is above the $0.0800 level, the price could recover steadily. A successful break above the $0.0830 and $0.0850 resistance levels could boost the crypto market sentiment.
Technical Indicators
4 hours MACD – The MACD for XLM/USD is slowly moving into the bullish zone.
4 hours RSI – The RSI for XLM/USD is struggling well below the 50 level, with a bearish angle.
Key Support Levels – $0.0810 and $0.0800.
Key Resistance Levels – $0.0830, $0.0850 and $0.0900.


