- Stellar lumen price traded to a new monthly high at $0.0878 against the US Dollar.
- XLM price is currently correcting lower below $0.0850 and testing the 55 simple moving average (4-hours).
- There was a break below a key bullish trend line with support near $0.0840 on the 4-hours chart (data feed via Kraken).
- The pair could correct lower, but the $0.0800 and $0.0785 support levels might provide support.
Stellar lumen price is trading in a positive zone above $0.0800 against the US Dollar, similar to bitcoin. XLM price could resume its upward move as long as it is above $0.0785.
Stellar Lumen Price Analysis (XLM to USD)
After bitcoin’s rise, stellar lumen price was able to grind higher above $0.0840 against the US Dollar. The XLM/USD pair even broke the $0.0850 resistance and settled above the 55 simple moving average (4-hours).
It traded to a new monthly high at $0.0878 before starting a downside correction. There was a break below the $0.0850 support level. Moreover, there was a break below a key bullish trend line with support near $0.0840 on the 4-hours chart.
The pair is now trading below the 50% Fibonacci retracement level of the recent increase from the $0.0805 swing low to $0.0878 high. It seems like the 55 simple moving average (4-hours) is currently holding the decline.
An immediate support is near the $0.0822 level. It is close to the 76.4% Fibonacci retracement level of the recent increase from the $0.0805 swing low to $0.0878 high. If there is a downside break below the $0.0822 support, the price could test the main $0.0800 and $0.0795 support levels.
To push the price into a bearish zone, the bears need to clear the $0.0785 support zone (the last key breakout zone). Conversely, stellar price might stay above the $0.0800 and $0.0795 support levels.
An initial resistance is near the $0.0850 level. The first major resistance is near the $0.0870 level, above which the bulls are likely to aim more upsides above $0.0880 and $0.0900.
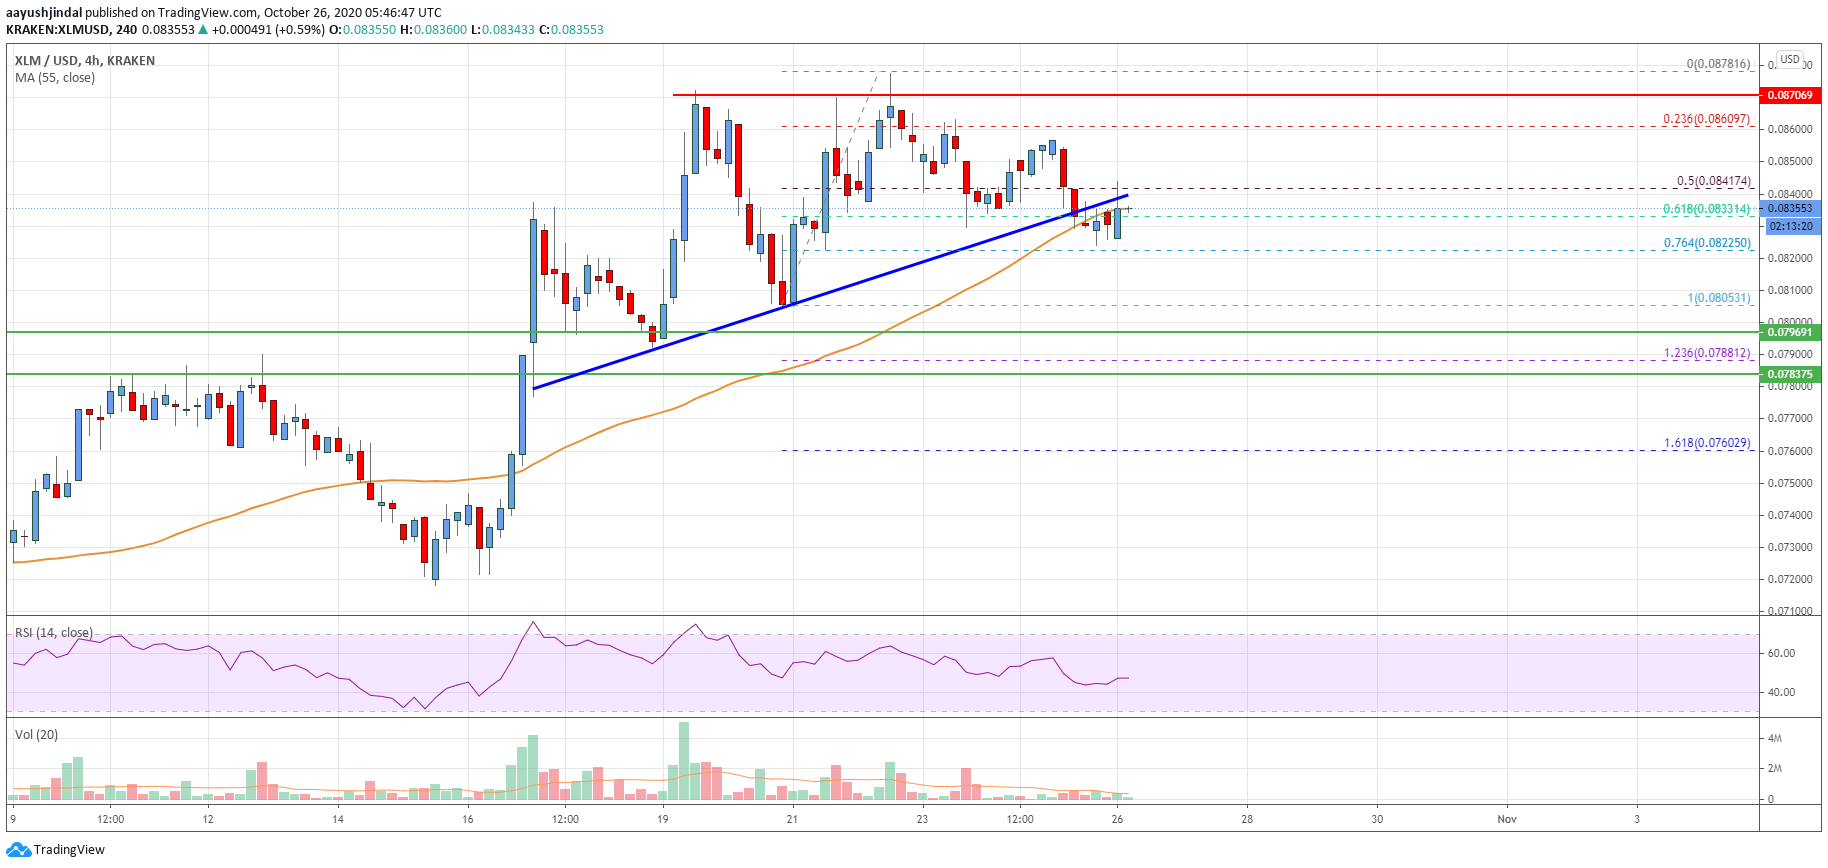
The chart indicates that XLM price is currently correcting lower below $0.0850 and testing the 55 simple moving average (4-hours). Overall, the price could correct lower, but the $0.0800 and $0.0785 support levels might provide support.
Technical Indicators
4 hours MACD – The MACD for XLM/USD is currently showing a few negative signs in the bullish zone.
4 hours RSI – The RSI for XLM/USD is currently just below the 50 level.
Key Support Levels – $0.0800 and $0.0785.
Key Resistance Levels – $0.0850, $0.0870 and $0.0900.