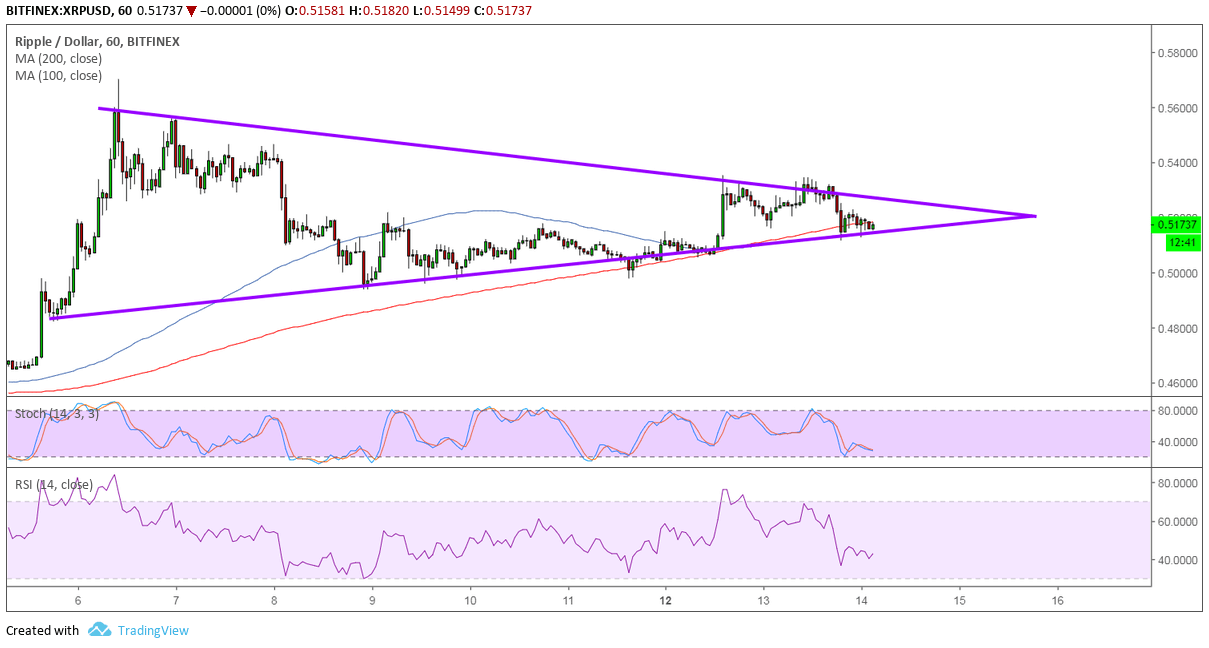
Ripple has formed lower highs and higher lows to create a symmetrical triangle pattern on its 1-hour time frame. Price is currently testing support and might be due for another bounce back to the top.
Note that Ripple is also nearing the peak of this triangle formation, which suggests that a breakout in either direction might be due soon. The 100 SMA is below the longer-term 200 SMA to signal that the path of least resistance is to the downside or that support is more likely to break than to hold.
In that case, Ripple could slide by around the same height as the triangle pattern, which spans .4800 to .5700. The moving averages line up with the triangle bottom and appear to be holding as dynamic support for the time being.
Stochastic is heading lower to indicate that sellers have the upper hand and could push for a candle closing below .5100. RSI is also heading south to signal that selling pressure is in play, but reaching oversold levels and turning back up could mean a bounce back to the top or a break higher.

Ripple has been on a longer-term ascent ever since breaking above a descending trend line visible on the daily or weekly charts. Price appears to have completed its retest on the breakout but is still struggling to gain stronger bullish traction.
Still, there is a lot to look forward to with Ripple as it is poised to make use of XRP in settling cross-border transactions through the xRapid platform. The company already has a number of big partners in its xCurrent messaging platform and would likely transition most of these to using XRP itself later on.
Last week, Ripple briefly overtook some of the top cryptocurrencies in terms of market cap due to its price surge, and it’s possible that it could happen again.
Images courtesy of TradingView


