- Ripple price is likely forming a strong support above the $0.1735 level resistance against the US dollar.
- The price is slowly rising above $0.1750 and the 55 simple moving average (4-hours).
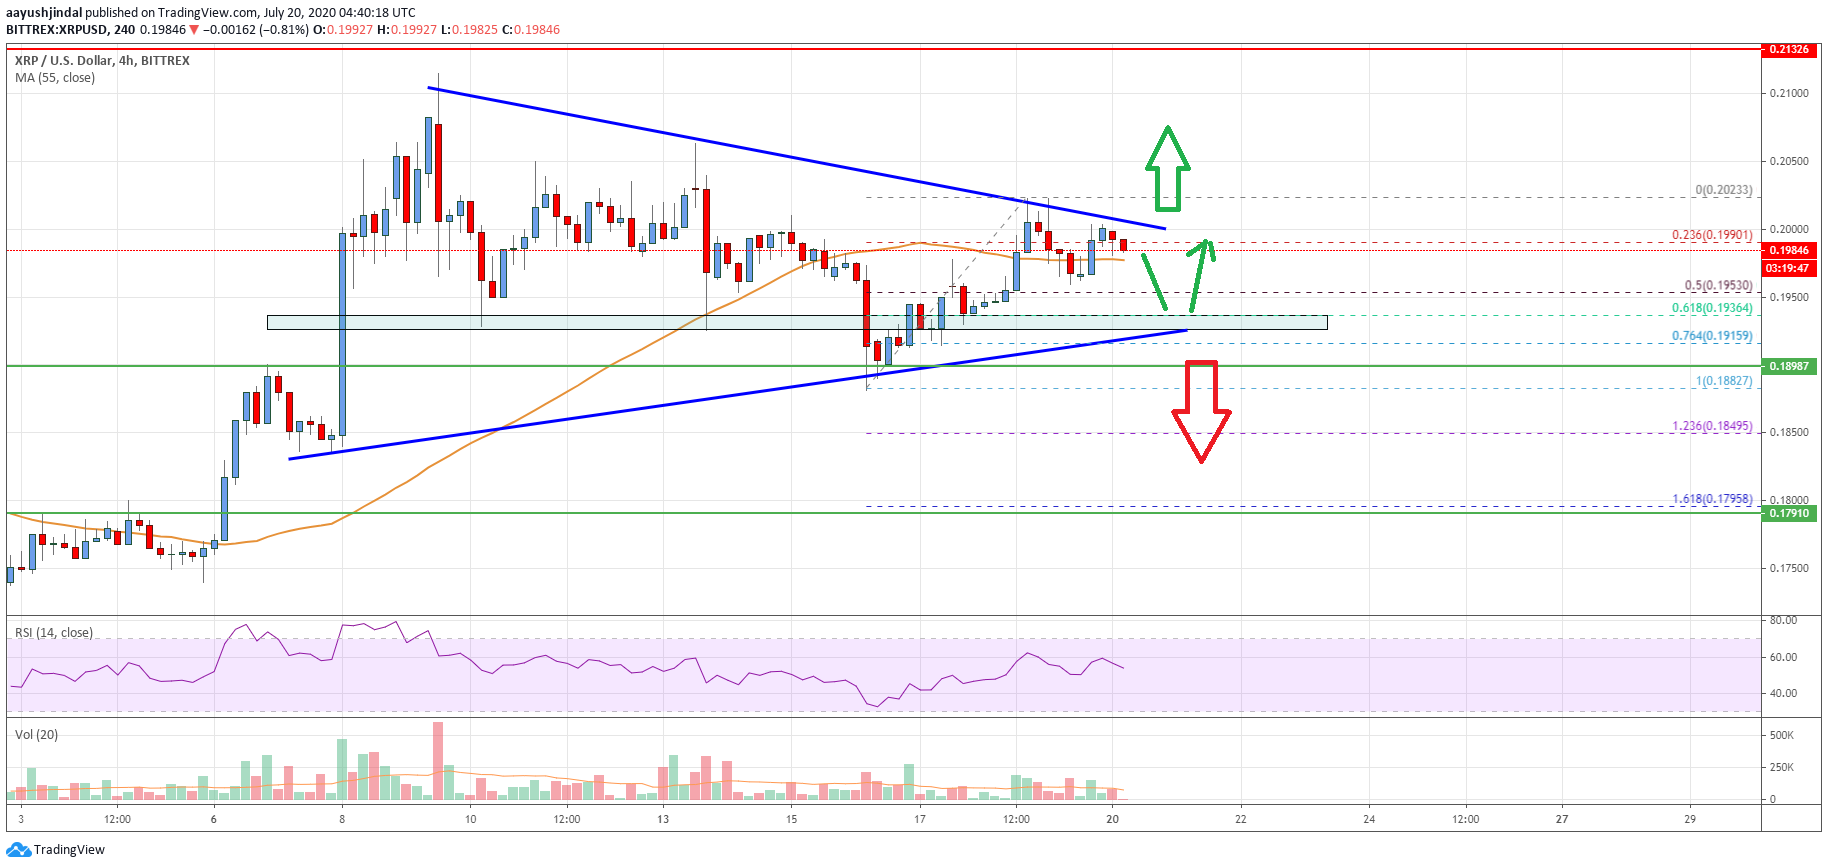
- There was a break above a crucial bearish trend line with resistance near $0.1760 on the 4-hours chart of the XRP/USD pair (data source from Bittrex).
- The pair is showing signs of upside continuation above the $0.0178 and $0.0180 resistance levels.
Ripple price is starting a decent increase from the $0.1692 low against the US Dollar. However, XRP price must gain traction above $0.1800 to start a fresh rally.
Ripple Price Analysis
Earlier, ripple price extended its decline below the $0.1800 level against the US Dollar. The XRP/USD pair broke the $0.1740 support level and settled below the 55 simple moving average (4-hours).
A swing low is formed near the $0.1692 level and the price is currently rising. It broke the $0.1750 resistance level to start a decent upside correction. There was a break above the 23.6% Fib retracement level of the recent drop from the $0.1865 swing high to $0.1692 low.
Moreover, there was a break above a crucial bearish trend line with resistance near $0.1760 on the 4-hours chart of the XRP/USD pair. The pair is now trading above the $0.1760 level and the 55 simple moving average (4-hours).
It is currently testing the 50% Fib retracement level of the recent drop from the $0.1865 swing high to $0.1692 low. It seems like the price might continue to rise above the $0.1780 level. The next key resistance is near the $0.1800 level.
A successful daily close above the $0.1800 resistance level might start a strong increase in the coming sessions. Conversely, the price might fail to surpass the $0.1800 resistance and start another decrease.
An initial support on the downside is near the $0.1735 level. The first major support is near the $0.1720 level, below which the price is likely to accelerate lower towards the $0.1680 and $0.1650 levels.
Looking at the chart, ripple price is clearly showing signs of upside continuation above the $0.0178 and $0.0180 resistance levels. If the bulls fail, there could be a strong bearish reaction.
Technical indicators
4 hours MACD – The MACD for XRP/USD is slowly gaining momentum in the bullish zone.
4 hours RSI (Relative Strength Index) – The RSI for XRP/USD is currently well above the 50 level.
Key Support Levels – $0.1735, $0.1720 and $0.1680.
Key Resistance Levels – $0.1800 and $0.1850.