Key Highlights
- Ripple price is setting up for the next break either above $0.3000 or below $0.2800 against the US dollar.
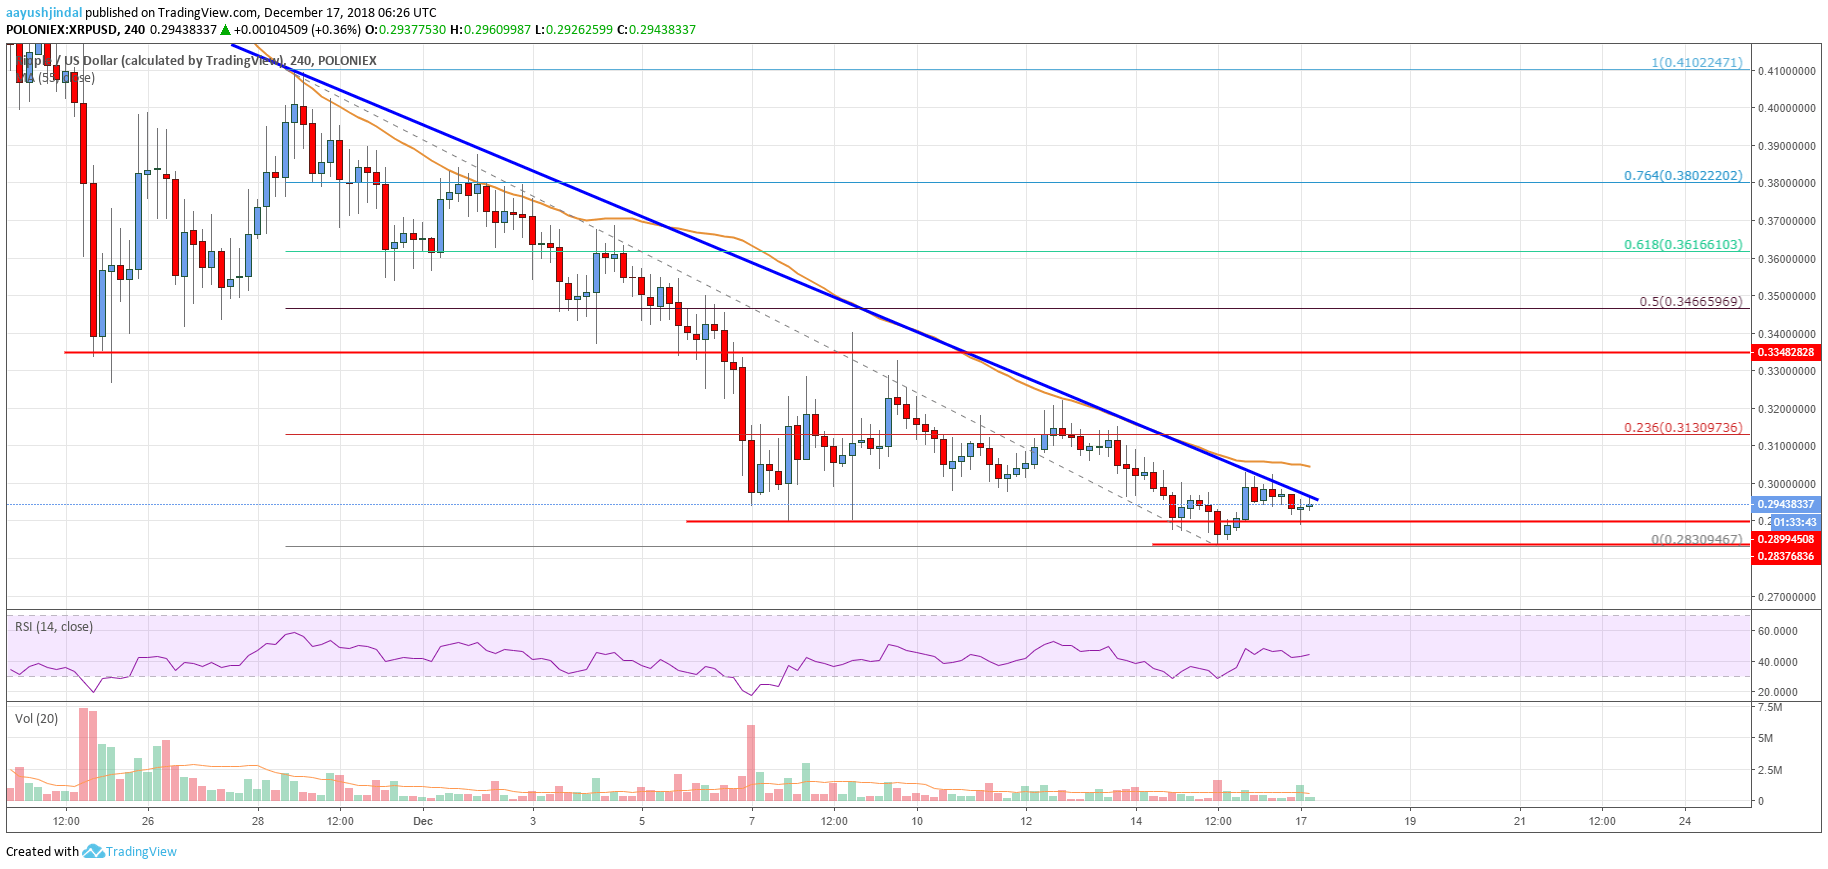
- There is a crucial bearish trend line formed with resistance at $0.3000 on the 4-hours chart of the XRP/USD pair (data source from Poloniex).
- The pair is likely to climb higher if there is a successful break above the $0.3000 resistance.
Ripple price is sighting a bullish break above $0.3000 against the US Dollar. Conversely, XRP might dive sharply if there is a break below the $0.2800 support.
Ripple Price Analysis
In the last analysis, we saw a significant breakout pattern below $0.3200 in ripple price against the US Dollar. The XRP/USD pair failed to move higher and it declined below the $0.3000 support level. The price even broke the $0.2900 level and remained below the 55 simple moving average (4-hours). A new monthly low was formed at $0.2830 and later the price recovered a few points.
On the upside, an initial barrier for buyers is near the $0.3000 level. Besides, there is a crucial bearish trend line formed with resistance at $0.3000 on the 4-hours chart of the XRP/USD pair. Above the trend line, the 55 SMA is positioned near $0.3040. Finally, the 23.6% Fib retracement level of the last decline from the $0.4102 high to $0.2830 low is at $0.3130. Therefore, if the price breaks the $0.3000 barrier, there could be more gains towards $0.3130 and $0.3200. The next major resistance is the 50% Fib retracement level of the last decline from the $0.4102 high to $0.2830 low at $0.3466.

Looking at the chart, ripple price is clearly near a crucial juncture below $0.3000. XRP could either break the $0.3000 resistance and trade towards $0.3200 or decline below $0.2830 in the near term.
Looking at the technical indicators:
4-hours MACD – The MACD for XRP/USD is still in the bearish zone.
4-hours RSI (Relative Strength Index) – The RSI for XRP/USD is just above the 40 level.
Key Support Level – $0.2830
Key Resistance Level – $0.3000


