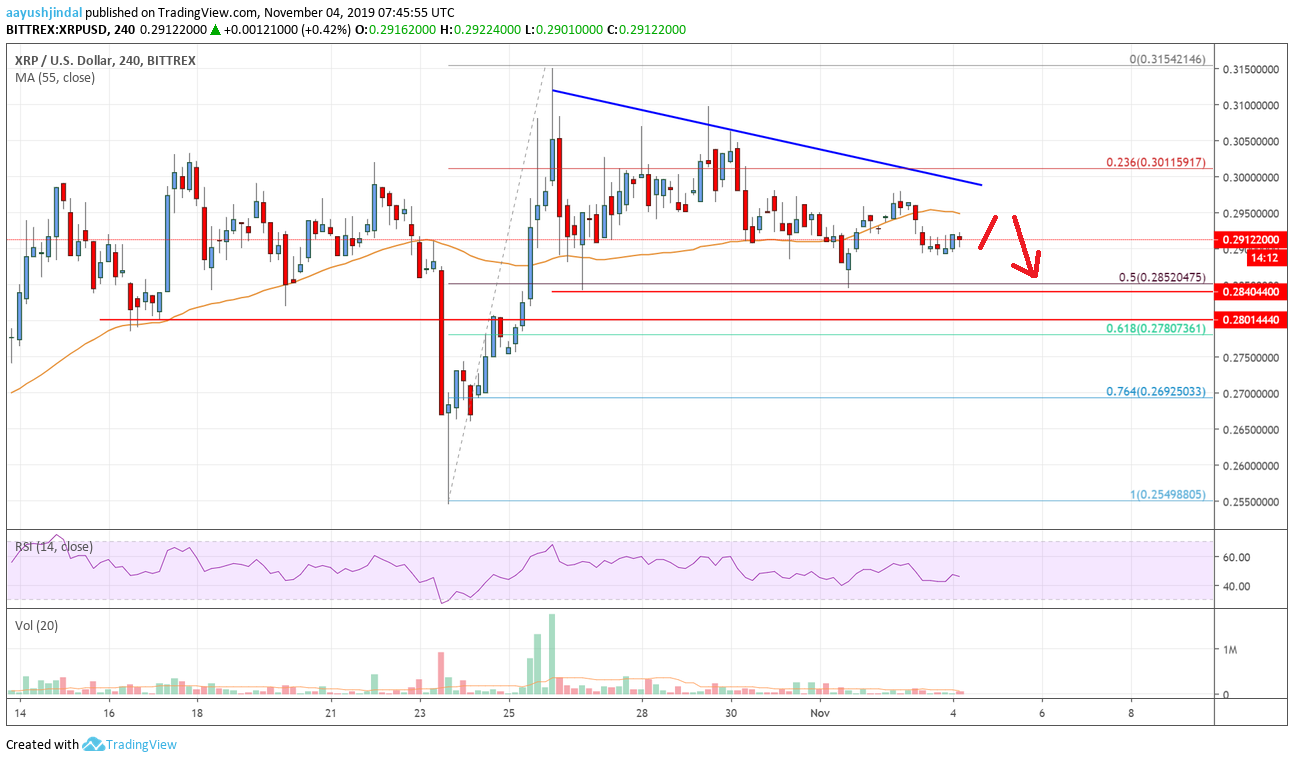
- Ripple price started a downside correction after tagging the $0.3150 resistance against the US dollar.
- The price is currently consolidating above the $0.2850 support area, with a few positive signs.
- There is a major bearish trend line forming with resistance near $0.2980 on the 4-hours chart of the XRP/USD pair (data source from Bittrex).
- The price must surpass the $0.3000 barrier for a fresh increase in the coming sessions.
Ripple price is facing a major hurdle near $0.3000 against the US Dollar. XRP price might rise again as long as there is no break below the $0.2800 support.
Ripple Price Analysis
This past week, there was a sharp rise above the $0.2800 and $0.3000 resistance levels. Moreover, there was a close above the $0.3000 level and the 55 simple moving average (4-hours).
The increase was such that the price traded above the $0.3120 resistance. A high was formed near $0.3154 before the price started a downside correction. There was a break below the $0.3000 pivot area.
Besides, the price traded below the 23.6% Fib retracement level of the upward move from the $0.2549 low to $0.3154 high. However, the price is currently finding strong bids near the $0.2850 area.
It seems like the 50% Fib retracement level of the upward move from the $0.2549 low to $0.3154 high is acting as a support. If there is a downside break below the $0.2850 support, there is a risk of further declines. However, the $0.2800 might provide support.
Only a close below the $0.2800 support area might start a significant decline. On the upside, there are a few important resistances forming near the $0.2980 and $0.3000 levels.
More importantly, there is a major bearish trend line forming with resistance near $0.2980 on the 4-hours chart of the XRP/USD pair. The main resistance is near the $0.3000 area.
Therefore, an upside break above the trend line, the 55 SMA, and $0.3000 might set the pace for another increase. The next key resistances are near the $0.3120 and $0.3150 levels. The main hurdle on the upside is near the $0.3200 area.

Looking at the chart, ripple price is facing an uphill task near the $0.3000 area. If there is a successful close above $0.3000, the price could resume uptrend. If not, there is a risk of an extended decline below the $0.2850 and $0.2800 support levels in the near term.
Technical indicators
4 hours MACD – The MACD for XRP/USD is slowly losing momentum in the bullish zone.
4 hours RSI (Relative Strength Index) – The RSI for XRP/USD is currently just below the 50 level.
Key Support Levels – $0.2880, $0.2850 and $0.2800.
Key Resistance Levels – $0.3000 and $0.3150.


