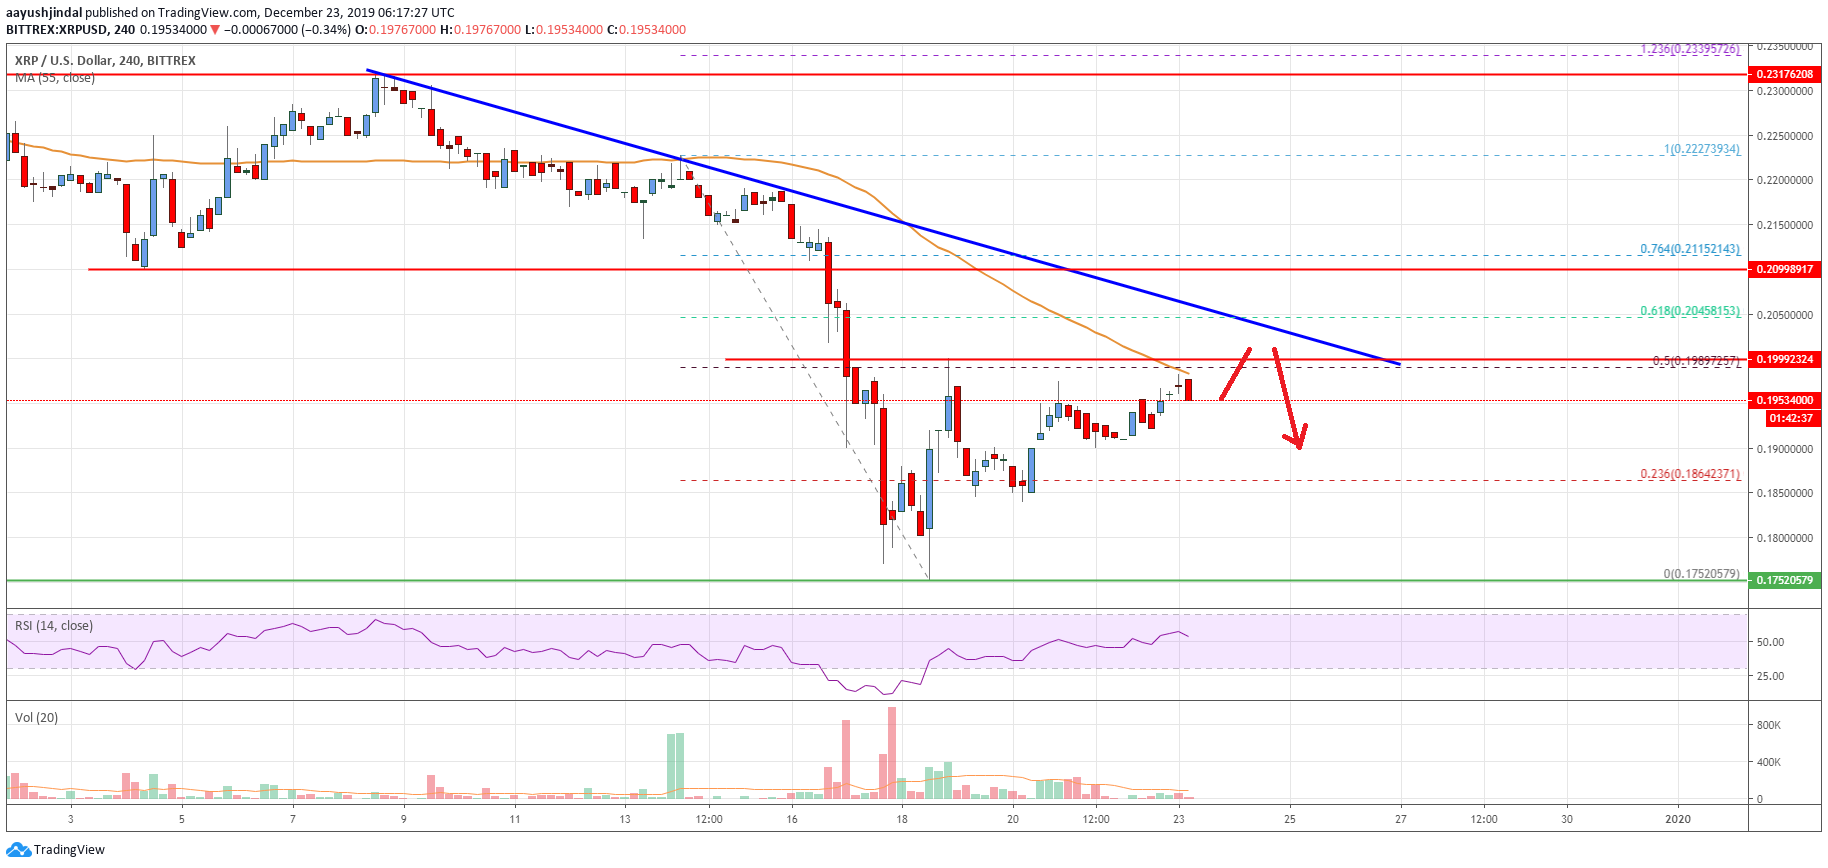
- Ripple price started an upside correction from the $0.1750 swing low against the US dollar.
- The price is trading above the $0.1900 level, but facing many hurdles near $0.2000
- There is a major bearish trend line forming with resistance near $0.2050 on the 4-hours chart of the XRP/USD pair (data source from Bittrex).
- A clear break above $0.2000 and $0.2050 is needed for upside acceleration.
Ripple price is trading below key hurdles near $0.2000 against the US Dollar. XRP price could either rally sharply above $0.2050 or it might revisit $0.1750.
Ripple Price Analysis
After a steady decline, ripple price found support near the $0.1750 level against the US Dollar. As a result, XRP/USD started an upside correction and traded above the $0.1800 resistance.
Moreover, there was a break above the 23.6% Fib retracement level of the downward move from the $0.2227 high to $0.1752 low. However, the upward move faced a strong resistance near the $0.2000 level and the 55 simple moving average (4-hours).
Besides, the 50% Fib retracement level of the downward move from the $0.2227 high to $0.1752 low is acting as a resistance. More importantly, there is a major bearish trend line forming with resistance near $0.2050 on the 4-hours chart of the XRP/USD pair.
Therefore, a clear break above the $0.2000 and $0.2050 resistance levels is needed for upside continuation. The next major resistance is seen near the $0.2100 area, and the 76.4% Fib retracement level of the downward move from the $0.2227 high to $0.1752 low.
Any further upsides could push the price towards the $0.2300 and $0.2315 resistance levels in the near term. On the downside, an initial support is near the $0.1900 level.
If the bulls fail to keep the price above the $0.1900 level, there is a risk of a bearish break below the $0.1800 support level. In the mentioned case, the price could even trade below the $0.1750 low in the coming days.
The next major support below $0.1750 is near the $0.1650 level, where the bulls are likely to appear.

Looking at the chart, ripple price is clearly trading near a couple of important hurdles at $0.2000 and $0.2050. Therefore, a clear break above $0.2050 may perhaps spark a nice rally. If not, the price could restart its downtrend below $0.1900 in the near term.
Technical indicators
4 hours MACD – The MACD for XRP/USD is losing momentum in the bullish zone.
4 hours RSI (Relative Strength Index) – The RSI for XRP/USD is currently correcting lower towards the 50 level.
Key Support Levels – $0.1900, $0.1800 and $0.1750.
Key Resistance Levels – $0.2000 and $0.2050.


