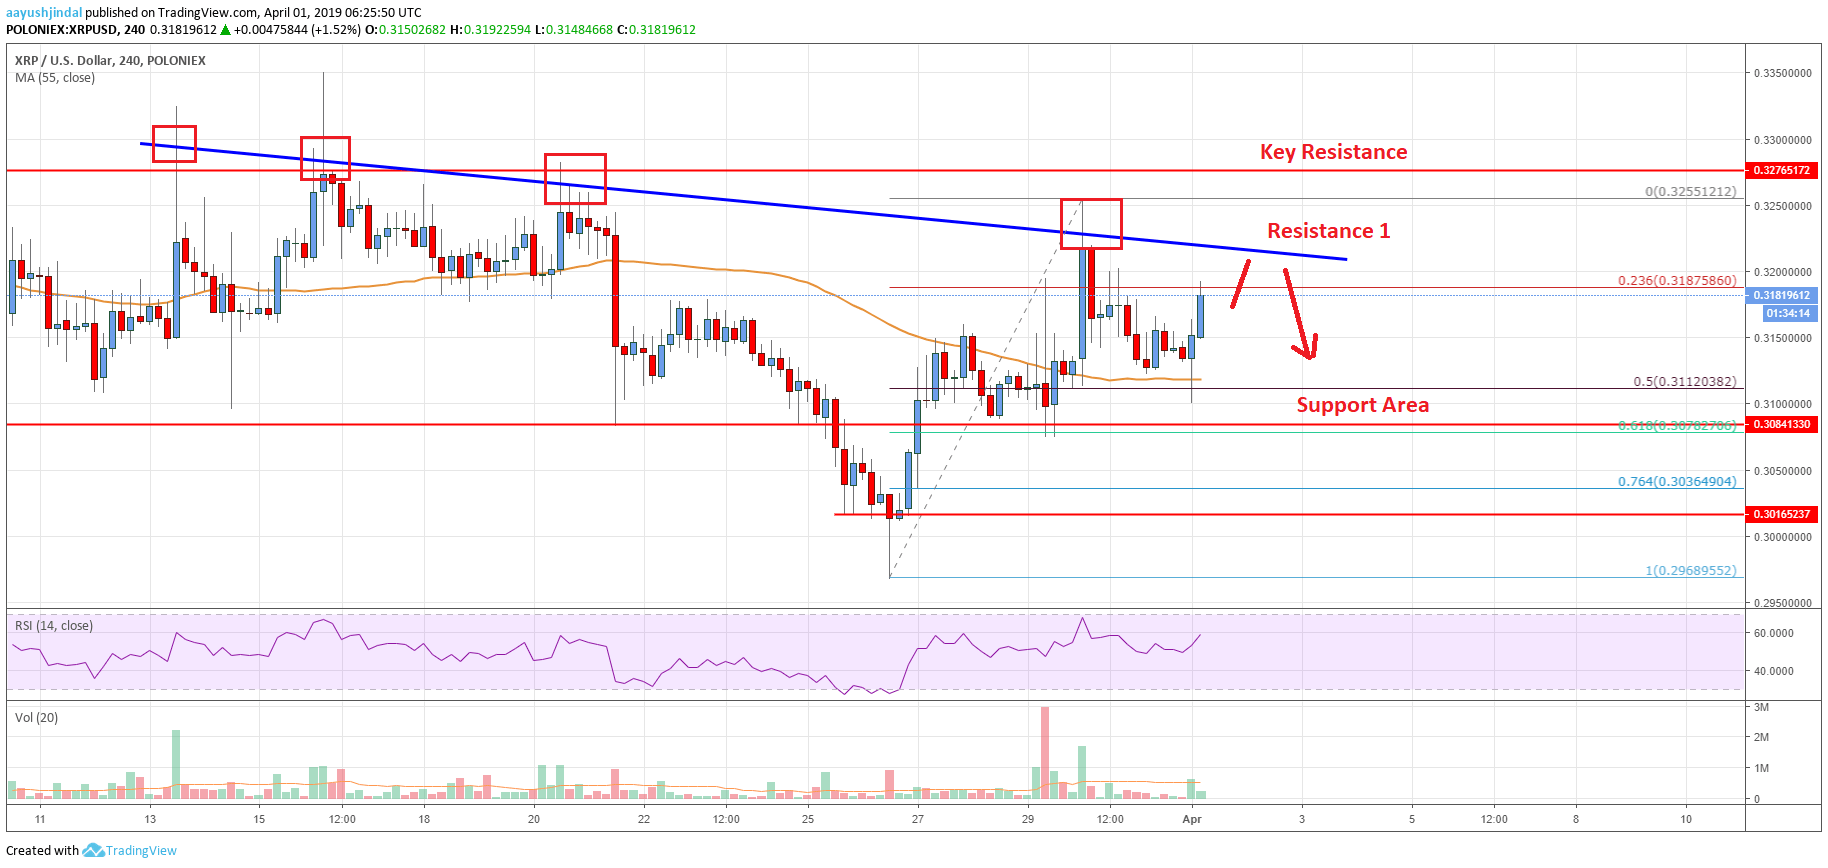
- Ripple price declined heavily before buyers appeared near the $0.2965 support against the US dollar.
- There was a sharp rebound and the price moved above the $0.3050 and $0.3100 resistances.
- There is a crucial bearish trend line in place with resistance at $0.3220 on the 4-hours chart of the XRP/USD pair (data source from Poloniex).
- The price is likely to face a strong resistance near the $0.3220 and $0.3250 levels in the near term.
Ripple price rebounded nicely above $0.3100 against the US Dollar. XRP must surpass the $0.3250 and $0.3300 barriers to start a strong bullish wave in the coming days.
Ripple Price Analysis
This past week, there were positive moves in bitcoin, Ethereum, bitcoin cash, ADA and ripple against the US Dollar. Earlier, the XRP/USD pair declined heavily and broke the $0.3080 and $0.3000 support levels. There was even a spike below $0.2980 and the price traded as low as $0.2968. Later, the price recovered significantly above the $0.3000 and $0.3100 resistance levels. The price even settled above the $0.3100 level and the 55 simple moving average (4-hours).
However, the upside move faced a strong resistance near the $0.3250 level. There is also a crucial bearish trend line in place with resistance at $0.3220 on the 4-hours chart of the XRP/USD pair. The pair dipped recently below $0.3200, and 23.6% Fib retracement level of the last wave from the $0.2968 low to $0.3255 high. However, the recent decline was protected by the $0.3100 support and the 55 simple moving average (4-hours).
Besides, the 50% Fib retracement level of the last wave from the $0.2968 low to $0.3255 high acted as a strong support. The price bounced back and it is currently approaching the $0.3200 resistance and the same bearish trend line. If there is a break above the trend line, the price could retest the $0.3255 resistance area. A clear break above the $0.3255 resistance may perhaps set the pace for more gains towards $0.3500 and $0.3750 barriers.

Looking at the chart, ripple price is placed nicely above the $0.3110 level and the 55 simple moving average (4-hours). Having said that, buyers need to gain bullish momentum above the $0.3220 and $0.3250 levels. On the downside, an initial support is at $0.3150 level, below which it could retest the $0.3110 support. Only a daily close below $0.3100 is likely to push the price into a bearish zone.
Technical indicators
4 hours MACD – The MACD for XRP/USD is currently gaining bullish momentum, with a positive bias.
4 hours RSI (Relative Strength Index) – The RSI for XRP/USD is currently well above the 55 level.
Key Support Levels – $0.3150, $0.3110 and $0.3100.
Key Resistance Levels – $0.3220 and $0.3250.


