- Ripple price started a major decline from well above the $0.2300 level against the US dollar.
- The price is now trading in a bearish zone below the $0.2000 pivot level.
- There was a break below a crucial bullish trend line with support near $0.2165 on the 4-hours chart of the XRP/USD pair (data source from Bittrex).
- The pair could correct a few points, but the bears are likely to protect $0.2085 or $0.2110.
Ripple price is currently recovering from the $0.1880 swing low against the US Dollar. XRP price is likely to continue lower towards $0.1750 unless it climbs above $0.2110.
Ripple Price Analysis
This past week, ripple price surged above the $0.2200 resistance area against the US Dollar. The XRP/USD pair even spiked above the $0.2300 level, but it struggled to gain traction above $0.2350.
Later, the price formed a support base above $0.2150 and made a few attempts to climb above $0.2250, but it failed. As a result, there was a sharp decline below the $0.2150 and $0.2110 support levels.
During the decline, there was a break below a crucial bullish trend line with support near $0.2165 on the 4-hours chart of the XRP/USD pair. The pair settled below the $0.2000 pivot level and the 55 simple moving average (4-hours).
A swing low is formed near $0.1878 and the price is currently correcting. It seems like there is a short term declining channel forming with resistance near $0.1995 on the same chart.
Ripple price is currently consolidating near the 23.6% Fib retracement level of the key decline from the $0.2253 high to $0.1878 low. On the upside, there is a major hurdle forming near the $0.2000 level.
If there is an upside break above the $0.2000 level, the price could correct higher towards the $0.2085 level. It is also close to the 50% Fib retracement level of the key decline from the $0.2253 high to $0.1878 low.
To move into a positive zone, XRP price must climb above $0.2060 and $0.2085 in the near term. If not, the price is likely to resume its decline below $0.1900 and $0.1880. The next major support is seen near the $0.1765 level, where the bulls might take a stand.
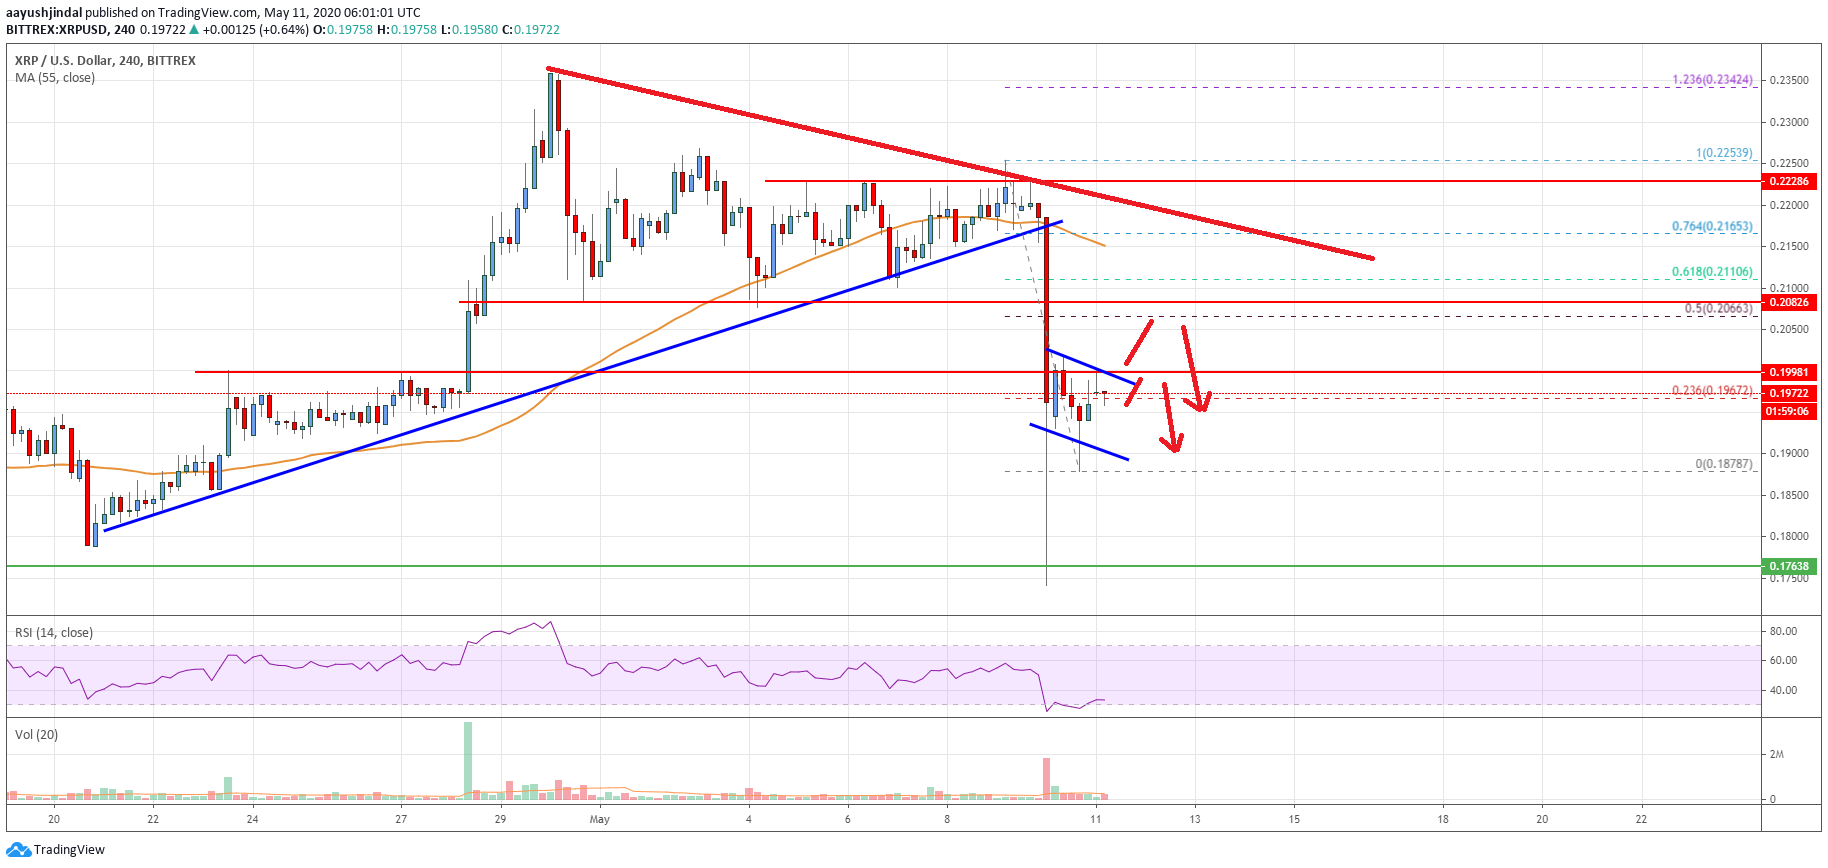
Looking at the chart, ripple price is clearly trading in a bearish zone below $0.2000 and $0.2085. Therefore, there is a risk of more downsides towards the $0.1765 and $0.1750 support levels.
Technical indicators
4 hours MACD – The MACD for XRP/USD is losing momentum in the bearish zone.
4 hours RSI (Relative Strength Index) – The RSI for XRP/USD is currently recovering towards the 40 level.
Key Support Levels – $0.1900, $0.1880 and $0.1765.
Key Resistance Levels – $0.2000 and $0.2085.