- Ripple price is still struggling to clear the $0.2500 and $0.2575 resistance levels against the US dollar.
- The price is consolidating above the $0.2400 support, but it is below the 55 simple moving average (4-hours).
- There is a major breakout pattern forming with support near $0.2430 on the 4-hours chart of the XRP/USD pair (data source from Bittrex).
- The pair could decline heavily if it breaks the $0.2400 support level in the near term.
Ripple price is facing an uphill task near $0.2500 against the US Dollar. XRP price must break $0.2500 and $0.2575 to avoid a nasty decline below $0.2400.
Ripple Price Analysis
After testing the $0.2300 zone, ripple price started a decent recovery against the US Dollar. The XRP/USD pair traded above the $0.2400 resistance zone and the 55 simple moving average (4-hours).
However, the price struggled to clear the $0.2575 zone. A high is formed near $0.2580 before the price declined back below $0.2500. There was also a break below the $0.2450 support and the 55 simple moving average (4-hours).
A low is formed near $0.2424 and the price is currently consolidating. It is testing the 55 SMA, and the 23.6% Fib retracement level of the recent decline from the $0.2580 swing high to $0.2424 low.
It seems like there is a major breakout pattern forming with support near $0.2430 on the 4-hours chart of the XRP/USD pair. If there is a downside break below the trend line, there is a risk of a larger decline below the $0.2400 support.
The next major support is near the $0.2300 level, below which the bears might aim a test of the $0.2200 level. The channel resistance is near the $0.2500 level. The 50% Fib retracement level of the recent decline from the $0.2580 swing high to $0.2424 low is also near the channel resistance.
Therefore, the price must break the channel resistance to start a fresh increase. The next major resistance is near the $0.2575 level, above which the bulls are likely to take control and aim a test of the $0.2720 level.
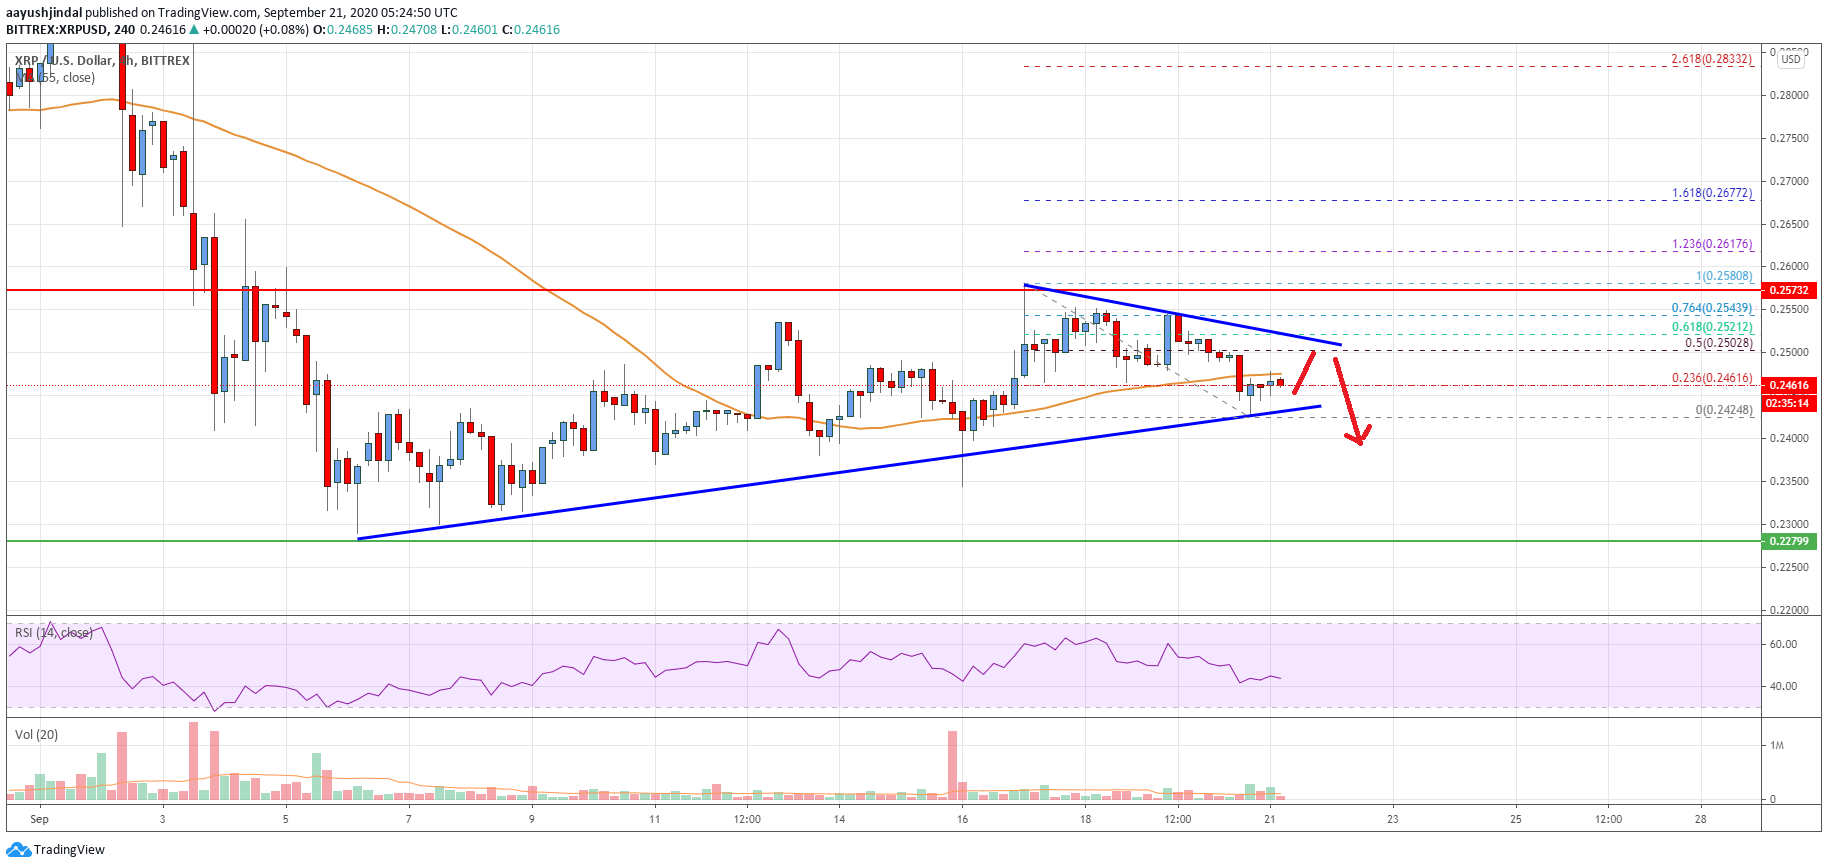
Looking at the chart, ripple price is clearly consolidating above the $0.2400 support, but it is below the 55 simple moving average (4-hours). Therefore, the price could decline heavily if it breaks the $0.2400 support level in the near term.
Technical indicators
4 hours MACD – The MACD for XRP/USD is struggling to gain pace in the bullish zone.
4 hours RSI (Relative Strength Index) – The RSI for XRP/USD is still below the 50 level.
Key Support Levels – $0.2430, $0.2400 and $0.2300.
Key Resistance Levels – $0.2500 and $0.2575.