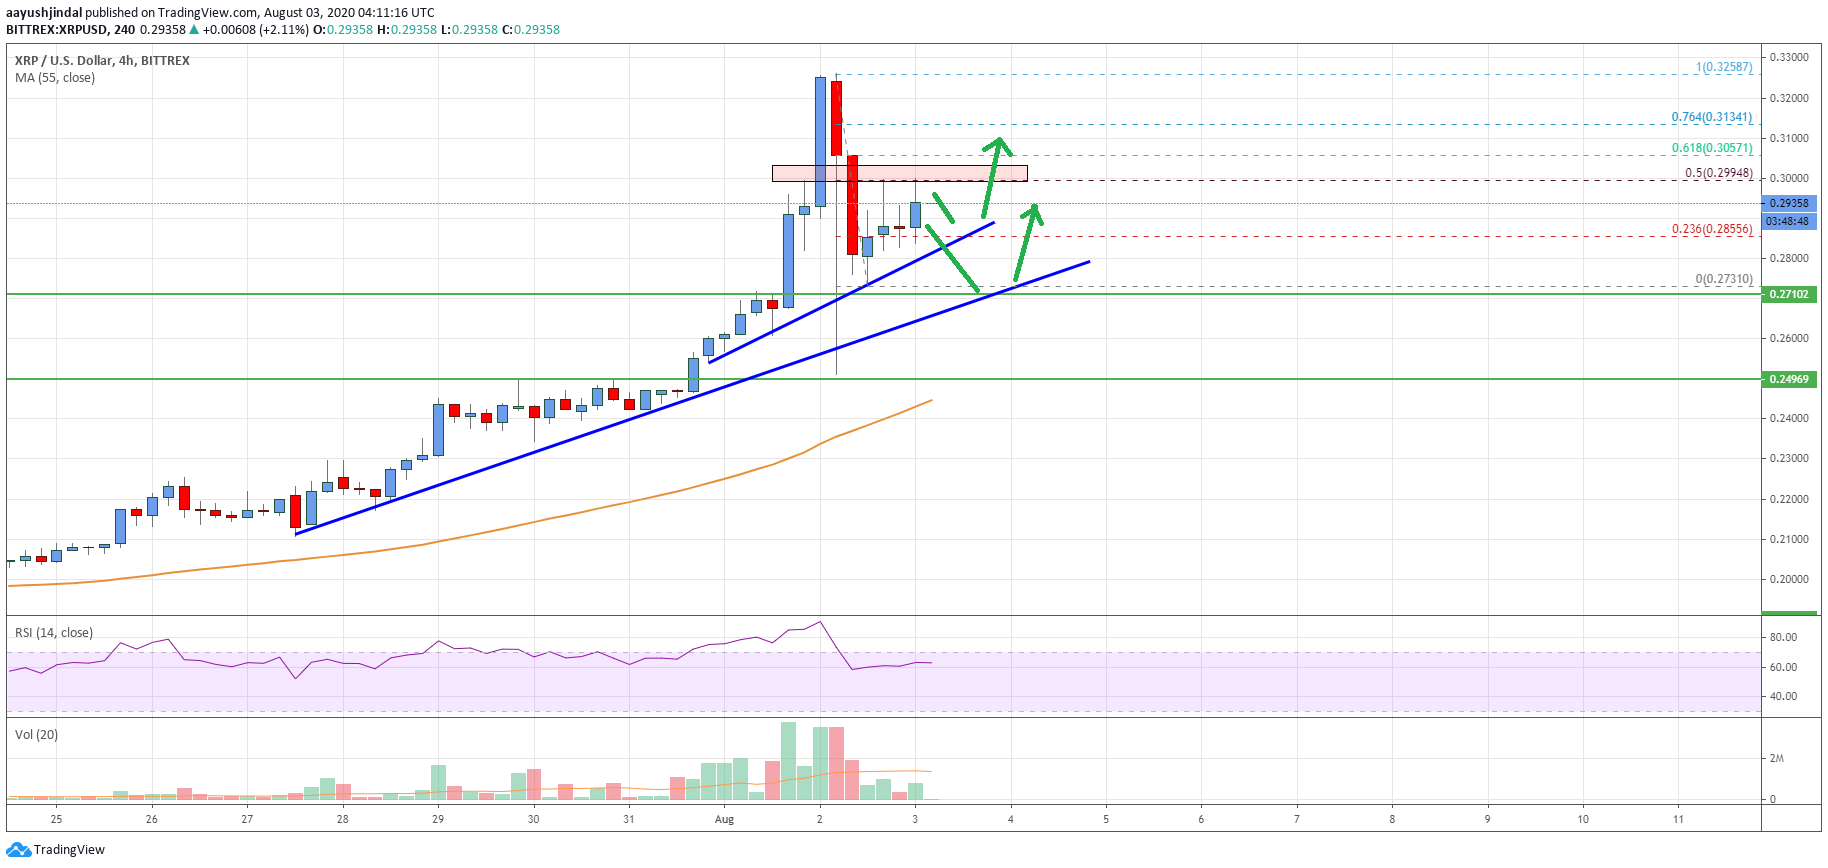
- Ripple price rallied significantly above the $0.3000 and $0.3100 levels against the US dollar.
- The price corrected lower sharply from $0.3260, but the bulls defended $0.2720.
- There are two key bullish trend lines forming with support near $0.2850 and $0.2785 on the 4-hours chart of the XRP/USD pair (data source from Bittrex).
- The pair is likely to resume its upward move once it clears the $0.2980 and $0.3000 resistance levels.
Ripple price is trading in a strong uptrend above $0.2720 and $0.2800 against the US Dollar. XRP price could accelerate its rise once again above the $0.3000 pivot level.
Ripple Price Analysis
In the past few days, there was a strong upward move in ripple price above $0.2500 against the US Dollar. The XRP/USD pair surged above the $0.2720 resistance zone and settled well above the 55 simple moving average (4-hours).
The bulls even pushed the price above the $0.3000 pivot level. The price traded to a new multi-month high near $0.3258 before there was a sharp bearish reaction. XRP dipped sharply below the $0.3000 and $0.2850 support levels.
However the bulls remained active above the $0.2600 and $0.2720 levels. There are also two key bullish trend lines forming with support near $0.2850 and $0.2785 on the 4-hours chart of the XRP/USD pair.
The pair is now trading above the $0.2920 level. An initial resistance is near the $0.2980 level. The 50% Fib retracement level of the recent decline from the $0.3258 swing high to $0.2731 swing low is also acting as a hurdle near $0.2995.
If there is an upside break above the $0.2980 and $0.3000 levels, the price is likely to continue higher. The next key resistance is near the $0.3055 level. It represents the 61.8% Fib retracement level of the recent decline from the $0.3258 swing high to $0.2731 swing low.
A clear break above the $0.3055 resistance may perhaps open the doors for a fresh surge. In the mentioned case, the price is likely to rally towards the $0.3200 and $0.3220 resistance levels.
Conversely, the price might struggle to clear $0.3000 or $0.3055. On the downside, the price is likely to find a strong buying interest near the second trend line at $0.2785.

Looking at the chart, ripple price is clearly trading near a couple of important hurdles at $0.3000. It seems the pair is likely to resume its upward move as long as it is above $0.2850 and $0.2785.
Technical indicators
4 hours MACD – The MACD for XRP/USD is slowly moving back into the bullish zone.
4 hours RSI (Relative Strength Index) – The RSI for XRP/USD is still above the 60 level.
Key Support Levels – $0.2850, $0.2800 and $0.2780.
Key Resistance Levels – $0.3000 and $0.3055.


