- Ripple price started a fresh increase above the $1.20 resistance against the US dollar.
- The price is now trading above $1.20 and the 55 simple moving average (4-hours).
- There is a key bullish trend line forming with support near $1.168 on the 4-hours chart of the XRP/USD pair (data source from Bittrex).
- The pair could continue to move up if there is a clear break above $1.28.
Ripple price is slowly rising above $1.25 against the US Dollar, unlike bitcoin. XRP price must clear $1.28 for another increase in the near term.
Ripple Price Analysis
After forming a base above $1.05, ripple price started a fresh increase against the US Dollar. The XRP/USD pair broke the $1.15 and $1.20 resistance levels to move into a positive zone.
The pair even settled above the $1.20 level and the 55 simple moving average (4-hours). Finally, there was a spike above the $1.25 level. A high was formed near $1.276 and the price is now consolidating gains.
On the downside, an initial support is near the $1.235 level. It is near the 23.6% Fib retracement level of the recent increase from the $1.102 swing low to $1.276 high. The first major support is near the $1.22 level. The next major support is near the $1.18 level.
It is near the 50% Fib retracement level of the recent increase from the $1.102 swing low to $1.276 high. Besides, there is a key bullish trend line forming with support near $1.168 on the 4-hours chart of the XRP/USD pair.
Any more losses could lead the price towards the $1.10 level in the near term. On the upside, an initial hurdle is near the $1.276 level. The next key resistance is near the $1.28 level, above which the price could test $1.30. Any more gains could lead the price towards the $1.35 level.
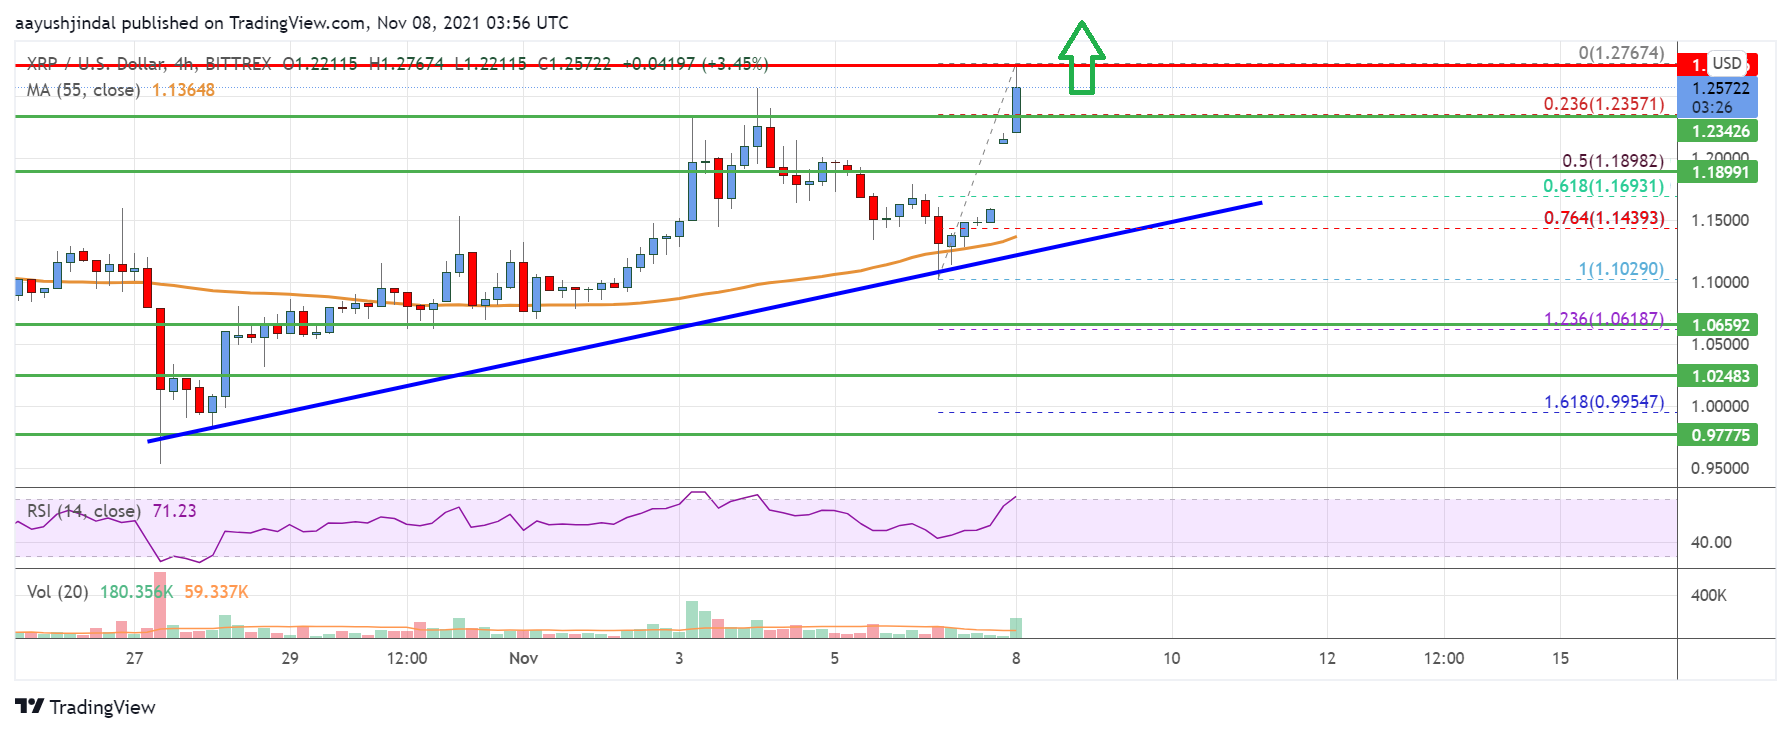
Looking at the chart, ripple price is now trading above $1.20 and the 55 simple moving average (4-hours). Overall, the price could continue to move up if there is a clear break above $1.28.
Technical indicators
4 hours MACD – The MACD for XRP/USD is slowly gaining momentum in the bullish zone.
4 hours RSI (Relative Strength Index) – The RSI for XRP/USD is now above the 60 level.
Key Support Levels – $1.235, $1.20 and $1.18.
Key Resistance Levels – $1.276 and $1.30.