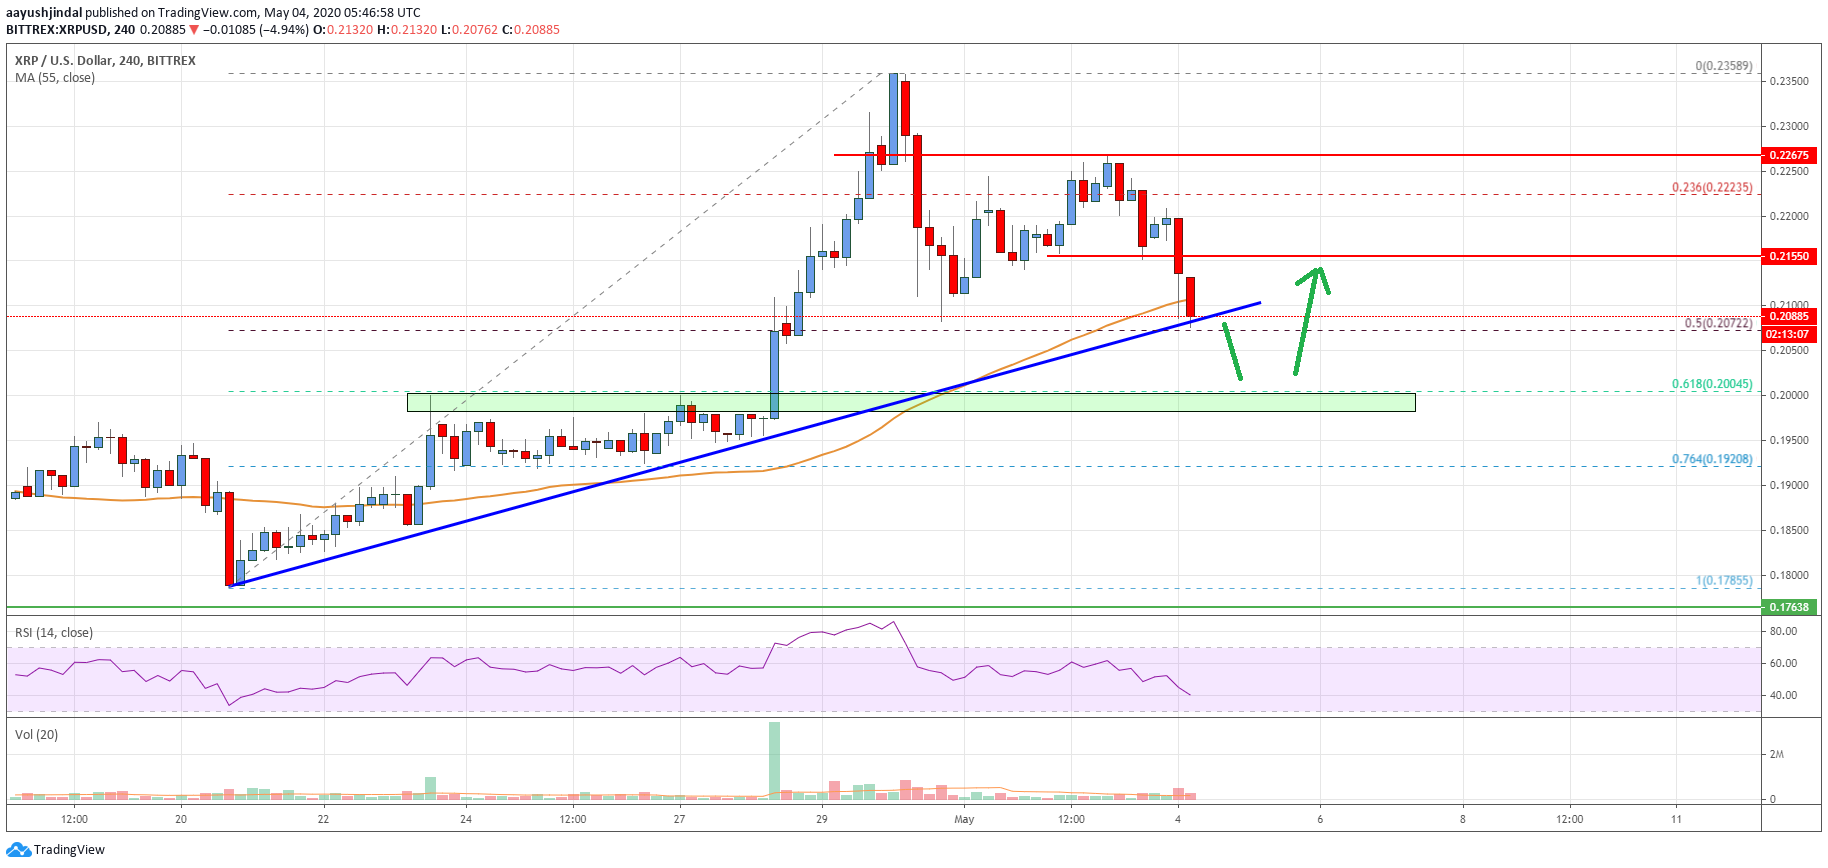
- Ripple price is currently correcting lower from the $0.2358 swing high against the US dollar.
- The price is likely to find a strong support on the downside near $0.2000.
- There is a major bullish trend line forming with support near $0.2085 on the 4-hours chart of the XRP/USD pair (data source from Bittrex).
- The pair could start a fresh upward move if it clears the $0.2155 resistance area.
Ripple price is currently correcting from the last week high against the US Dollar. XRP price must stay above the $0.2000 support for a fresh increase in the near term.
Ripple Price Analysis
This past week, ripple price surged above the $0.2000 resistance area against the US Dollar. The XRP/USD pair broke the $0.2080 and $0.2200 resistance levels to start a bullish trend.
There was also a close above the $0.2000 level the 55 simple moving average (4-hours). The price traded to a new monthly high at $.2358 and recently started a downside correction below the $0.2300 level.
Ripple price traded below the 23.6% Fib retracement level of the upward move from the $0.1785 low to $0.2358 high. The price is now trading below the $0.2110 level and it is testing the $0.2085 support.
There is also a major bullish trend line forming with support near $0.2085 on the 4-hours chart of the XRP/USD pair. The trend line coincides with the 50% Fib retracement level of the upward move from the $0.1785 low to $0.2358 high.
The 55 simple moving average (4-hours) is also near the trend line support. If the price fails to stay above the $0.2085 and $0.2080 support levels, it could continue to decline.
The next major uptrend support is near the $0.2000 level (the last breakout zone). It is close to the 61.8% Fib retracement level of the upward move from the $0.1785 low to $0.2358 high.
Therefore, a downside break below the $0.2000 support could start a bearish trend. If not, the price is likely to start a fresh increase above the $0.2120 and $0.2155 levels. The main hurdle for the bulls is near the $0.2350 level.

Looking at the chart, ripple price is clearly trading in a positive zone above the $0.2080 and $0.1900 levels. Having said that, the bulls need to protect the $0.2000 support for a fresh increase towards $0.2350.
Technical indicators
4 hours MACD – The MACD for XRP/USD is gaining momentum in the bearish zone.
4 hours RSI (Relative Strength Index) – The RSI for XRP/USD is currently declining towards the 40 level.
Key Support Levels – $0.2080, $0.2020 and $0.2000.
Key Resistance Levels – $0.2155 and $0.2200.


