- Ripple price is currently struggling to clear the $0.1650 and $0.1700 resistance levels against the US dollar.
- The price is now trading below $0.1550 and it is likely to extend its decline.
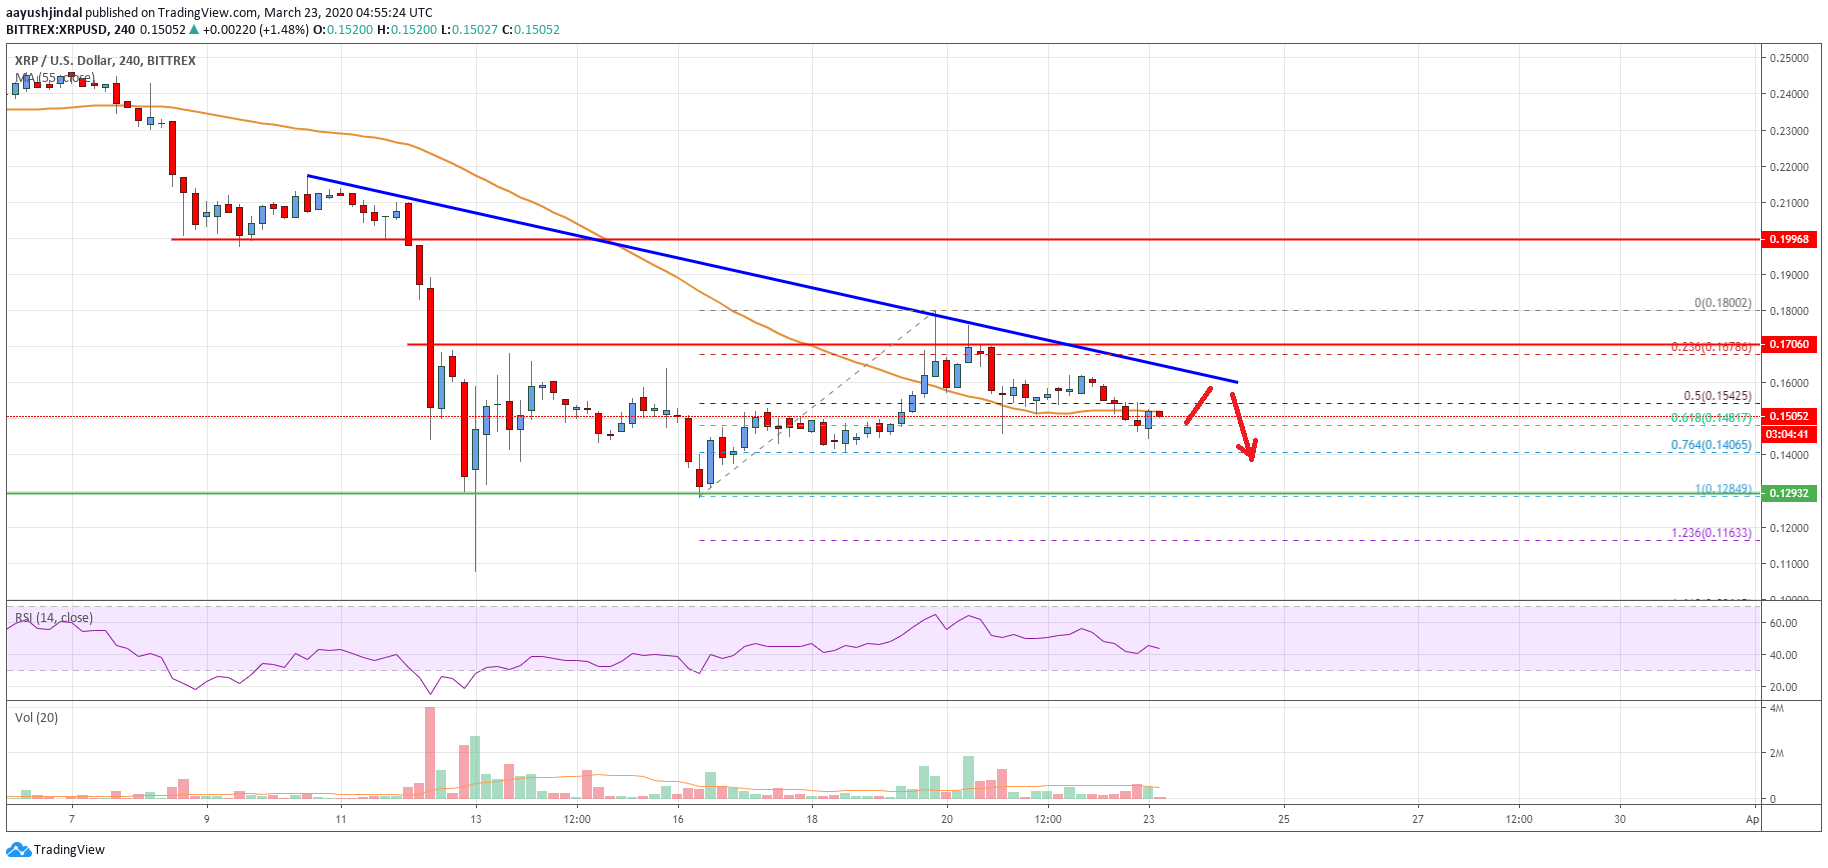
- There is a key bearish trend line forming with resistance near $0.1600 on the 4-hours chart of the XRP/USD pair (data source from Bittrex).
- The pair could only surge higher if there is a clear break above the $0.1600 and $0.1700 levels.
Ripple price is trading in a bearish zone below $0.1700 against the US Dollar. XRP price is likely to continue lower and it might revisit the $0.1300 support area.
Ripple Price Analysis
In the past few days, we saw an upside correction in ripple price above the $0.1500 level against the US Dollar. XRP/USD traded above the $0.1700 resistance level and the 55 simple moving average (4-hours).
However, it struggled to stay above the $0.1700 resistance area. A high was formed near $0.1800 and the price started a fresh decline. There was a break below the $0.1700 area and the 55 simple moving average (4-hours).
The price traded below the 50% Fib retracement level of the upward move from the $0.1284 low to $0.1800 high. It is now trading near the $0.1500 pivot level and consolidating losses.
An initial support is near the $0.1480 level. It represents the 61.8% Fib retracement level of the upward move from the $0.1284 low to $0.1800 high. The next support is near the $0.1460 level, below which the price is likely to accelerate lower towards the $0.1300 support area.
On the upside, an initial resistance is near the $0.1600 level. There is also a key bearish trend line forming with resistance near $0.1600 on the 4-hours chart of the XRP/USD pair.
A clear break above the trend line resistance is needed for a decent increase towards the $0.1700 level. To start a strong increase, the price has to settle above the $0.1700 and $0.1720 levels. The next major resistance is near $0.1800, followed by $0.2000.
Looking at the chart, ripple price is clearly trading in a bearish zone below the $0.1700 and $0.1800 resistance levels. If the bulls fail to gain pace above $0.1700, there are chances of a downside extension below $0.1450.
Technical indicators
4 hours MACD – The MACD for XRP/USD is losing momentum in the bullish zone.
4 hours RSI (Relative Strength Index) – The RSI for XRP/USD is below the 40 level, with a bearish angle.
Key Support Levels – $0.1450, $0.1400 and $0.1300.
Key Resistance Levels – $0.1600 and $0.1700.