- Ripple price started a steady increase above the $1.00 resistance against the US dollar.
- The price is now trading above $1.10 and the 55 simple moving average (4-hours).
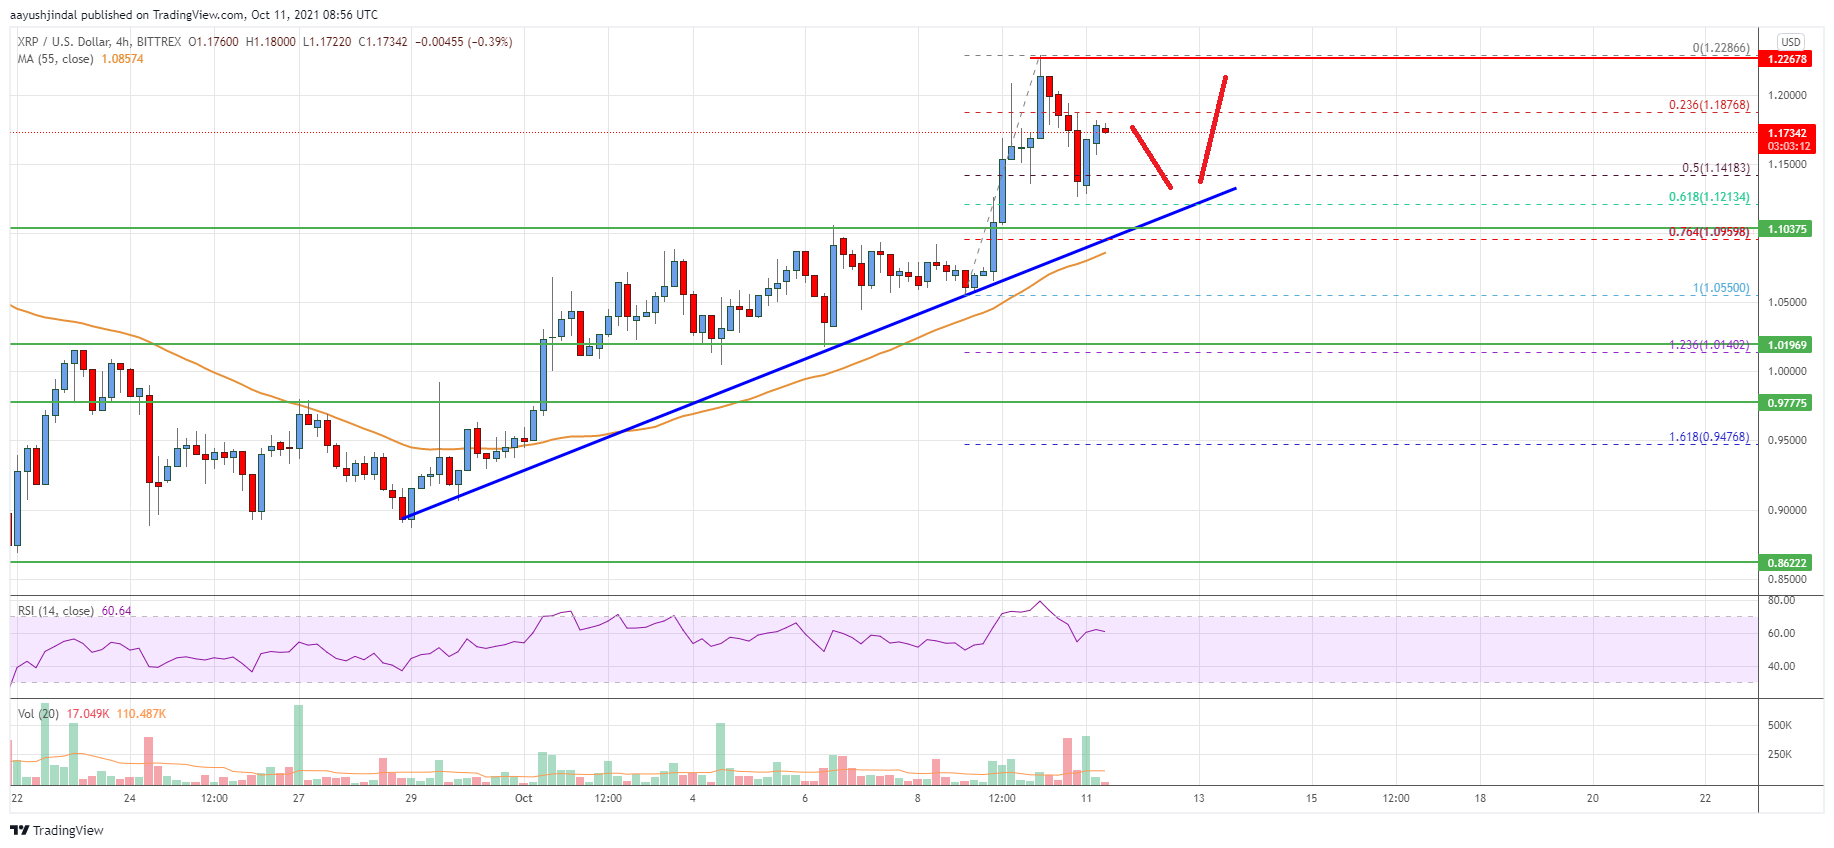
- There is a key bullish trend line forming with support near $1.120 on the 4-hours chart of the XRP/USD pair (data source from Bittrex).
- The pair could continue higher as long as it is above the $1.10 support zone.
Ripple price is showing positive signs above $1.10 against the US Dollar, similar to bitcoin. XRP price must clear $1.20 for more gains in the near term.
Ripple Price Analysis
After forming a base above $0.9500, ripple price started a fresh increase against the US Dollar. The XRP/USD pair broke the $0.9800 and $1.00 resistance levels to move into a positive zone.
The pair even surpassed the $1.100 resistance and the 55 simple moving average (4-hours). Finally, there was a spike above the $1.20 level and the price traded as high as $1.228. Recently, there was a downside correction below the $1.20 level.
The price declined below the 23.6% Fib retracement level of the recent increase from the $1.055 swing low to $1.228 high. However, dips remain limited below the $1.15 level.
The bulls were active near the 50% Fib retracement level of the recent increase from the $1.055 swing low to $1.228 high. There is also a key bullish trend line forming with support near $1.120 on the 4-hours chart of the XRP/USD pair.
The pair is now rising and trading above $1.15. On the upside, an initial hurdle is near the $1.20 level. The next key resistance is near the $1.22 level. A close above the $1.22 could set the pace for more gains. The next major resistance is near the $1.25 level. Any more gains could lead the price towards the $1.30 level.
On the downside, an initial support is near the $1.120 level. The first major support is near the $1.10 level. Any more losses could lead the price towards the $1.00 level in the near term.
Looking at the chart, ripple price is now trading above $1.10 and the 55 simple moving average (4-hours). Overall, the price could continue higher as long as it is above the $1.10 support zone.
Technical indicators
4 hours MACD – The MACD for XRP/USD is now gaining momentum in the bullish zone.
4 hours RSI (Relative Strength Index) – The RSI for XRP/USD is now above the 50 level.
Key Support Levels – $1.12, $1.10 and $1.00.
Key Resistance Levels – $1.20 and $1.25.