- Ontology price rallied recently by more than 25% and broke the $1.40 resistance against the US Dollar.
- ONT surpassed the market cap of ETC and NEO to climb at 17th position in the market cap.
- There is a major bullish trend line in place with support at $1.200 on the 4-hours chart of the ONT/USD pair (data feed from Binance).
- The price traded as high as $1.4417 recently and it may correct lower in the near term.
Ontology (ONT) rallied recently above $1.30 and $1.40 against the US dollar. ONT surpassed the market cap of ETC and NEO to climb to 17th spot, with a strong bullish momentum.
Ontology (ONT) Price Analysis
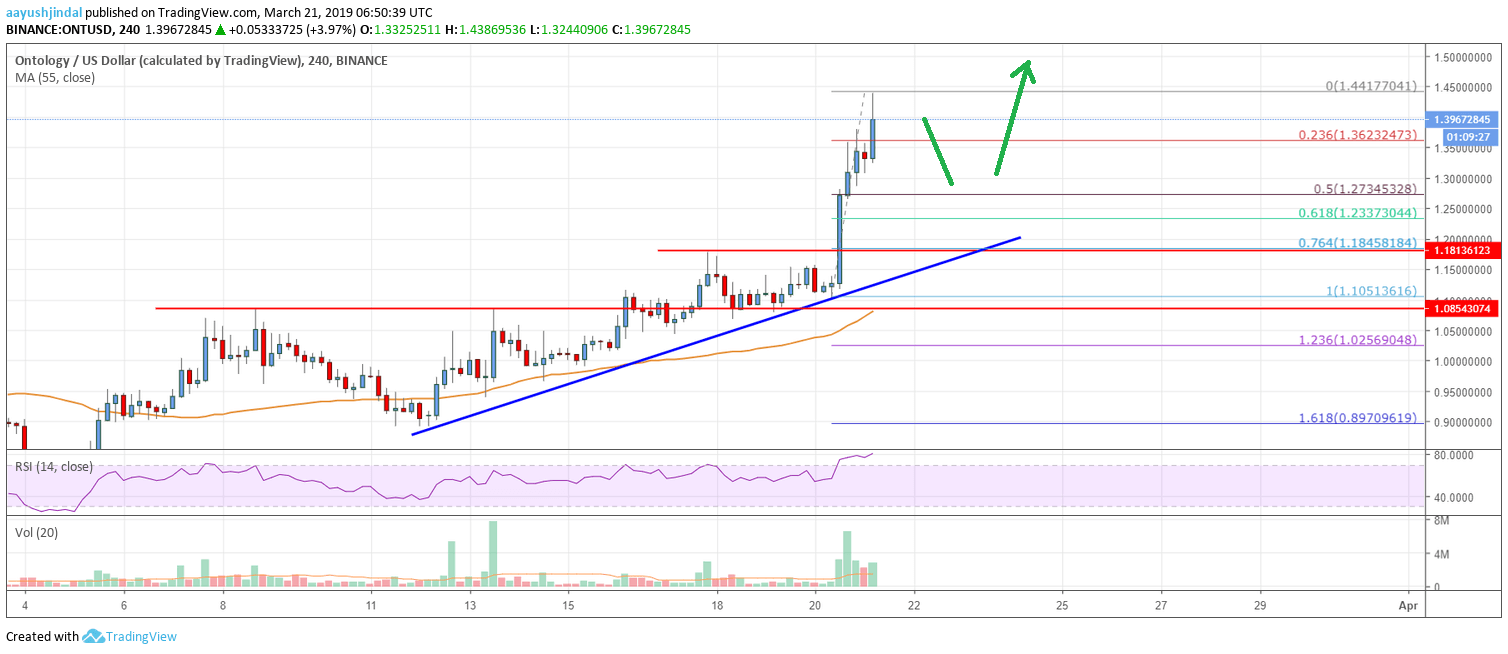
Yet another solid week for ontology (ONT) as its price rallied above the $1.20 barrier against the US dollar. Recently, there were positive moves in bitcoin, Ethereum, ripple, litecoin and EOS, helping ONT in gaining traction. After struggling near the $1.08 resistance for some time, buyers finally gained momentum. The price surged above the $1.10 and $1.20 resistance levels to start a solid uptrend. It rallied above the $1.40 resistance and traded to a new yearly high at $1.4417.
At the moment, the price is retreating from the $1.4417 high and it may correct lower in the near term. An initial support is $1.365 and the 23.6% Fib retracement level of the last wave from the $1.105 low to $1.441 high. If there is a downside extension, the price may test the $1.275 support. It represents the 50% Fib retracement level of the last wave from the $1.105 low to $1.441 high. Besides, there is a major bullish trend line in place with support at $1.200 on the 4-hours chart of the ONT/USD pair.
The trend line support is near the 61.8% Fib retracement level of the last wave from the $1.105 low to $1.441 high. Moreover, the price is well supported above the $1.20 pivot level and the 55 simple moving average (4-hours). Therefore, if there is a downside correction, the price is likely to find a lot of buyers near the $1.27 and $1.20 level. On the upside, an initial resistance is near $1.441, above which the price could trade towards $1.50.

Looking at the chart, ONT price is clearly surging higher, with a strong bullish angle above $1.30. Dips remain supported and there are high chances of more gains above $1.45 and $1.50.
Technical indicators
4 hours MACD – The MACD for ONT/USD is currently placed heavily into the bullish zone, with a positive bias.
4 hours RSI (Relative Strength Index) – The RSI climbed higher sharply and it is currently above the 70 level.
Major Support Levels – $1.3500 and $1.2750.
Major Resistance Levels – $1.4400 and $1.5000.


