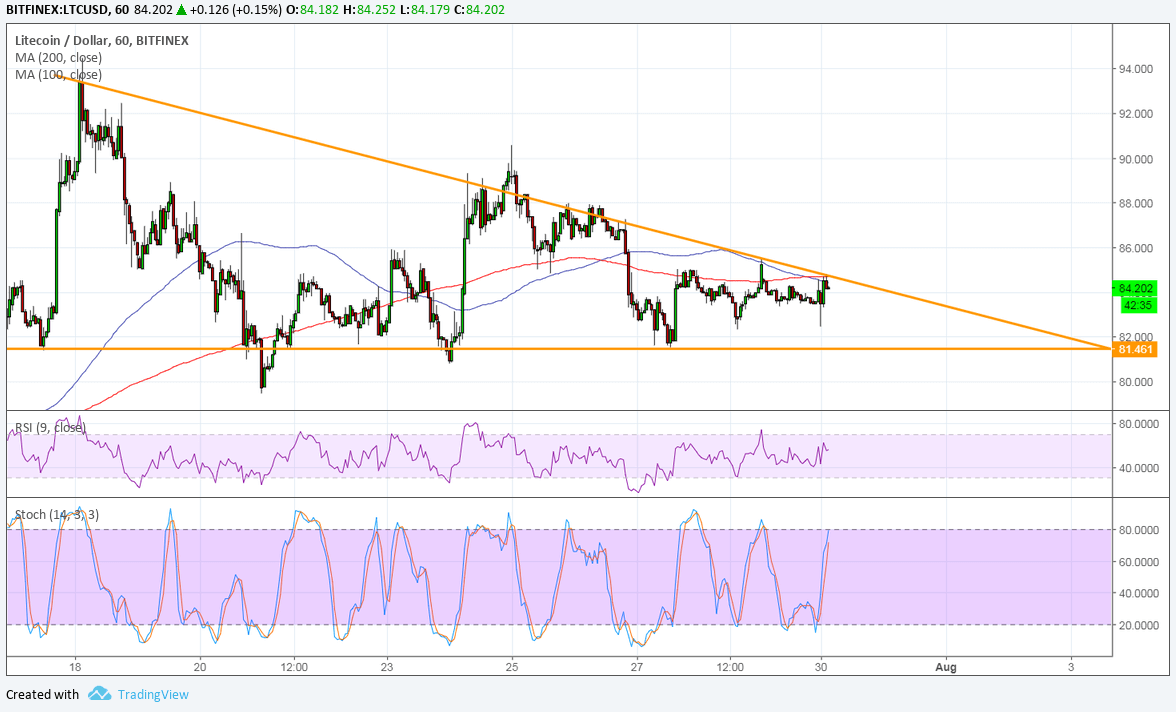
LTCUSD has formed lower highs and found support around 82.00 to create a descending triangle pattern on its 1-hour chart. Price is currently testing resistance and might be attempting to break higher since it created higher lows over the past couple of days.
However, the 100 SMA is crossing below the longer-term 200 SMA to signal that the path of least resistance is to the downside. In other words, resistance is more likely to hold than to break or support is more likely to break than to hold. These moving averages also line up with the triangle top to add to its strength as a ceiling.
RSI is hovering around middle ground to reflect current consolidation conditions and signal that these might persist. Price has some room before reaching the peak of the triangle pattern, so a breakout might have to wait.
Stochastic is on the move up to reflect the presence of bullish pressure, so there’s a potential for a break higher. However, the oscillator is also approaching overbought levels to signal buyer exhaustion and a possible return in bearish momentum.

LTCUSD and other cryptocurrency pairs have been mostly stuck in consolidation over the past few days as market watchers hold out for stronger catalysts. The industry was off to a solid start for the quarter, buoyed by optimism for a rebound. After a dip on negative commentary, bulls returned on news of stronger institutional interest and anticipation for bitcoin ETF approvals.
However, the SEC shelved some of the applications and denied one last week, keeping investors on edge and hopeful to get more positive updates. On the flip side, the dollar managed to get some support from strong growth expectations and positive trade developments. This week’s FOMC decision and NFP release should provide some direction, too.


