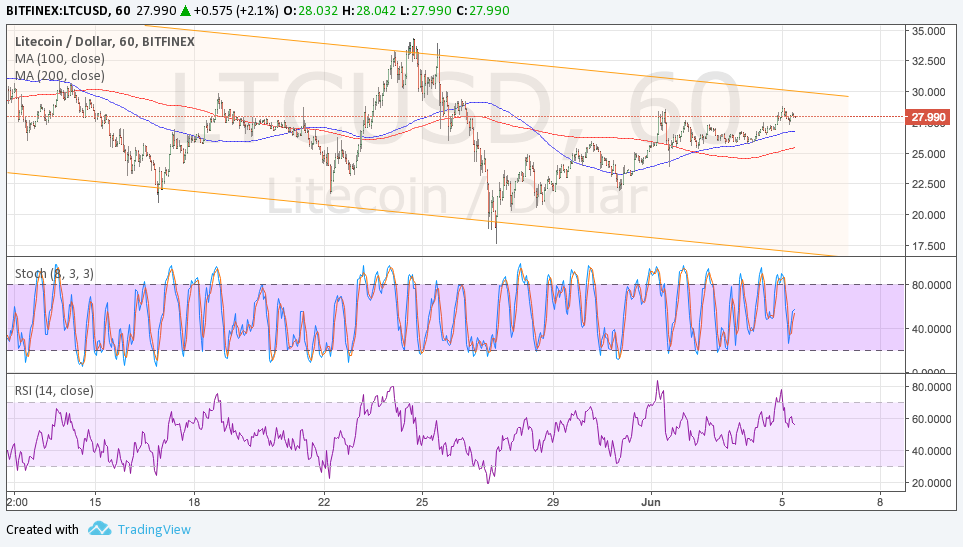
LTCUSD has been on a slow climb in the past few days, making its way close to the top of the descending channel visible on its 1-hour time frame. If this area holds as resistance, litecoin could make its way back down to support at 17.500 or at least until the mid-channel area of interest at 22.500.
The 100 SMA is above the longer-term 200 SMA on this chart so the path of least resistance is to the upside. In addition, the 100 SMA appears to have held as dynamic support so it might continue keeping losses in check for the time being. A larger pullback from the climb could also find a floor at the 200 SMA dynamic inflection point at 25.000.
Stochastic is still pointing up to show that buyers are in control of LTCUSD action and that further gains are possible. This oscillator has a ways to go before reaching overbought territory anyway. If bullish pressure stays in play, litecoin could even make it past the channel resistance and head further north.

However, RSI is already making its way down from the overbought levels to suggest a return in selling pressure. If this keeps up, litecoin could eventually slide back down to nearby support areas, possibly even making a break below the channel support if bearish momentum kicks into high gear.
Market factors are in support of digital currencies these days, though, as geopolitical tensions in the United Kingdom and in the Middle East could keep risk-off flows in play. These tend to favor alternative assets like bitcoin and litecoin because investors are on the hunt for higher returns outside of traditional financial markets like stocks and commodities.
In the UK, the snap elections are coming up and the Conservatives are seeing a narrower lead as the event approaches. This could open the chance for a political shakeup which might weaken the country’s negotiating stance during Brexit talks. In the Middle East, Saudi Arabia has cut diplomatic ties with Qatar for supporting extremist war efforts so there could be tensions there as well.


