Key Highlights
- Litecoin price mostly consolidated in a range and struggling to gain pace in the short term.
- There is a bullish trend line on the hourly chart with data feed from Bitfinex, as highlighted yesterday, which remained intact for the bulls.
- The price looks like struggling to hold the ground, as it moved below the 100 hourly simple moving average.
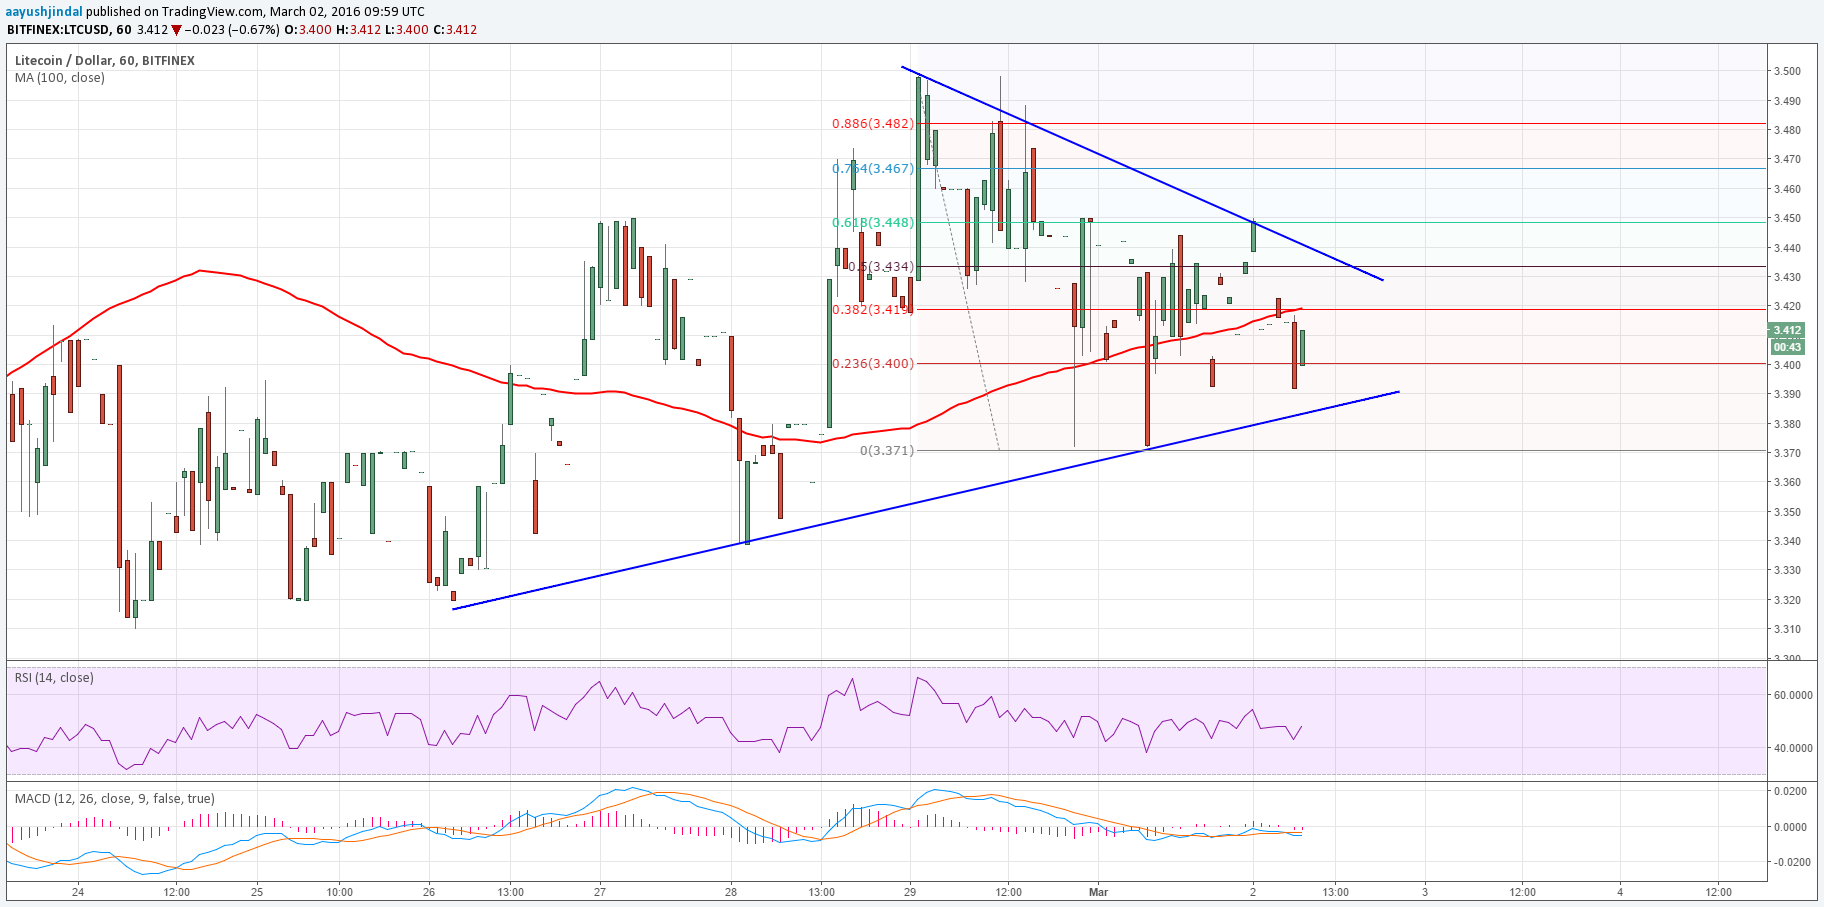
Litecoin price is consolidating and forming a breakout pattern. A break on either side may call for swing moves in the short term.
Wait for a break
Litecoin price showed no signs of life Intraday and continued to trade in a choppy manner. A bullish trend line on the hourly chart (lower triangle support trend line) with data feed from Bitfinex continued to act as a support area for the price, and there was no real movement. There was a bearish path set for the price, and there was no bullish move. It means the price remains at a risk of a breakdown compared with a move higher.
A break below the trend line support area could take the price towards the $3.30 levels. On the upside, an initial resistance is around the 38.2% Fib retracement level of the last drop from the $3.49 high to $3.37 low. The most important point is that the 100 hourly simple moving average is also aligned around the stated fib level.
A break above the 100 MA may take the price towards the triangle resistance trend line, which is sitting near the 50% Fib retracement level of the last drop from the $3.49 high to $3.37 low.
Looking at the indicators:
Hourly MACD – The MACD is in the bearish zone, which is a negative sign for the bulls.
Hourly RSI – The RSI is also below the 50 level, calling for a breakdown in the short term.
Intraday Support Level (HitBTC) – $3.37
Intraday Resistance Level (HitBTC) – $3.44
Charts from Bitfinex; hosted by Trading View


