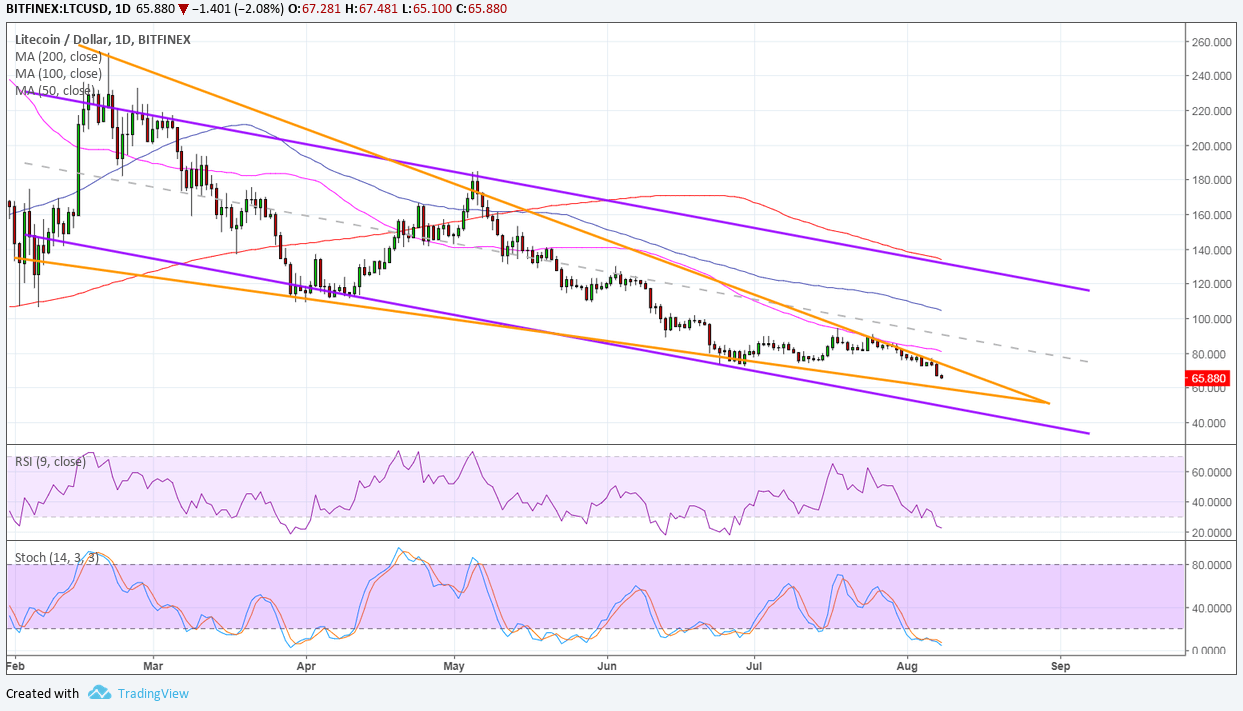
Litecoin formed lower highs and lower lows to trade inside a descending channel on the daily time frame. Price also appears to be consolidating inside a falling wedge as couldn’t seem to bust through the mid-channel area of interest recently.
Price is approaching the peak of the wedge, so a breakout might be due anytime soon. A break below support could lead to a break below the channel bottom as well, exposing litecoin to longer-term declines. On the other hand, a break past the wedge resistance could mean a test of the mid-channel area of interest at $80 or a move to the resistance at $120.
This channel top lines up with the 200 SMA dynamic inflection point, adding to its strength as a ceiling. The 100 SMA is below the longer-term 200 SMA after all, so the path of least resistance is to the downside. This means that the selloff is more likely to resume than to reverse. The 100 SMA might also hold as near-term resistance.

RSI is pointing down to signal that sellers have the upper hand and could take Litecoin down from here. Stochastic is also heading lower but in the oversold territory, so there’s a good chance of profit-taking at these levels. Of course the oscillators have yet to pull up before indicating a return in bullish pressure.
Litecoin and its peers are on shaky ground these days as the recent declines have drawn even more bears to join in. It didn’t help that the spotlight is back on the SEC decision to delay the ruling on the bitcoin ETF applications from SolidX, so market watchers would have to wait until September to hopefully get positive news.
For now, bearish vibes could linger unless there’s a strong positive catalyst that could revive optimism. In the previous month, institutional interest was the main driver for the rallies, so any updates in this regard could spur gains.


