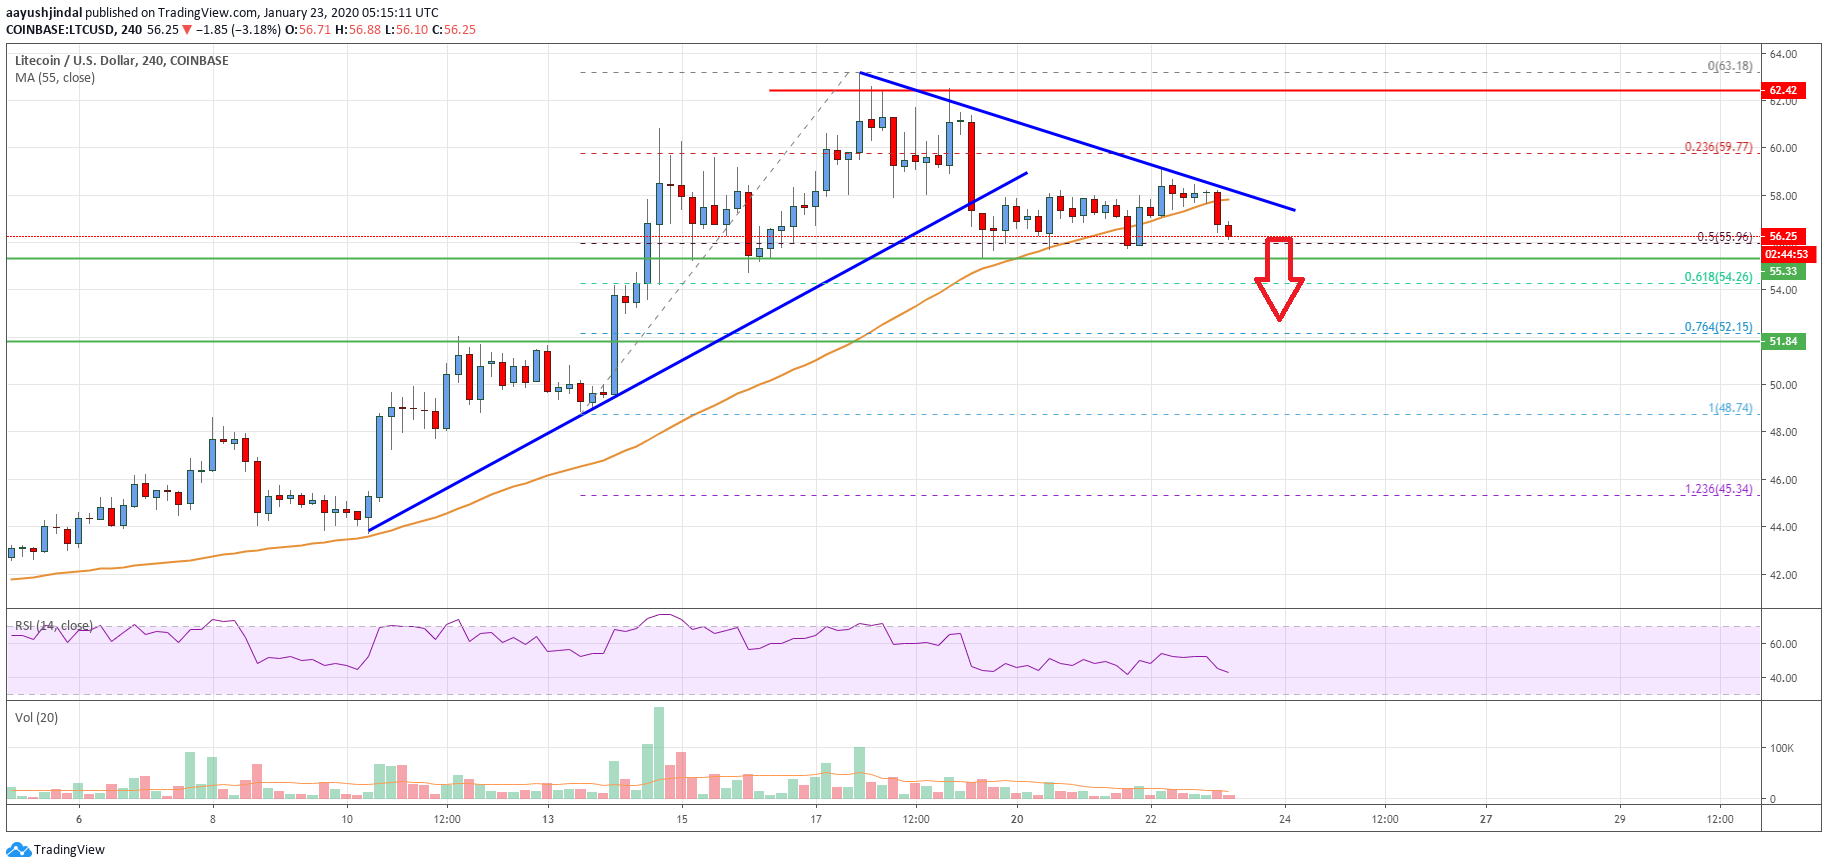
- Litecoin price topped near the $63.20 area and declined recently against the US Dollar.
- LTC price is now trading below the $60.00 level, with a couple of bearish signs.
- There is a key bearish trend line forming with resistance near $58.00 on the 4-hours chart of the LTC/USD pair (data feed from Coinbase).
- The pair remains at a risk of more downsides below the $55.00 support area.
Litecoin price is currently correcting lower below $60.00 against the US Dollar, similar to bitcoin. LTC price could continue to slide towards the key $52.00 support area.
Litecoin Price Analysis
This week, there were corrective moves in bitcoin, Ethereum, ripple and litecoin against the US Dollar. Earlier, LTC price surged above the $58.00 and $60.00 resistance levels.
It traded to a new 2020 high at $63.18 and recently started a downside correction. It traded below the key $60.20 and $60.00 support levels to enter a short term bearish zone.
Moreover, there was a break below a major bullish trend line with support at $58.00 on the 4-hours chart of the LTC/USD pair. It opened the doors for more losses and the price declined below $56.50 plus the 55 simple moving average (4-hours).
An immediate support is near the $55.90 level. It coincides with the 50% Fib retracement level of the upward wave from the $48.74 low to $63.18 high.
However, the current price action suggests that the price might continue to move down below $55.80 and $55.00. The next major support is near the $52.15 level. It represents the 76.4% Fib retracement level of the upward wave from the $48.74 low to $63.18 high.
Any further losses may perhaps lead litecoin price towards the key $50.00 support area in the near term. On the upside, an initial resistance is near the $58.00 level and the 55 simple moving average (4-hours).
Besides, there is a key bearish trend line forming with resistance near $58.00 on the same chart. Therefore, a proper break above the $58.00 resistance and a follow though above $60.00 is needed for more gains in the near term.

Looking at the chart, litecoin price is clearly correcting gains below $60.00. It seems like the bulls are losing control and there is a risk of a larger downside correction below $55.00 and $54.00 in the coming sessions.
Technical indicators
4 hours MACD – The MACD for LTC/USD is gaining pace in the bearish zone.
4 hours RSI (Relative Strength Index) – The RSI for LTC/USD is now well below the 50 level.
Key Support Levels – $55.80 and $52.00.
Key Resistance Levels – $58.00 and $60.00.


