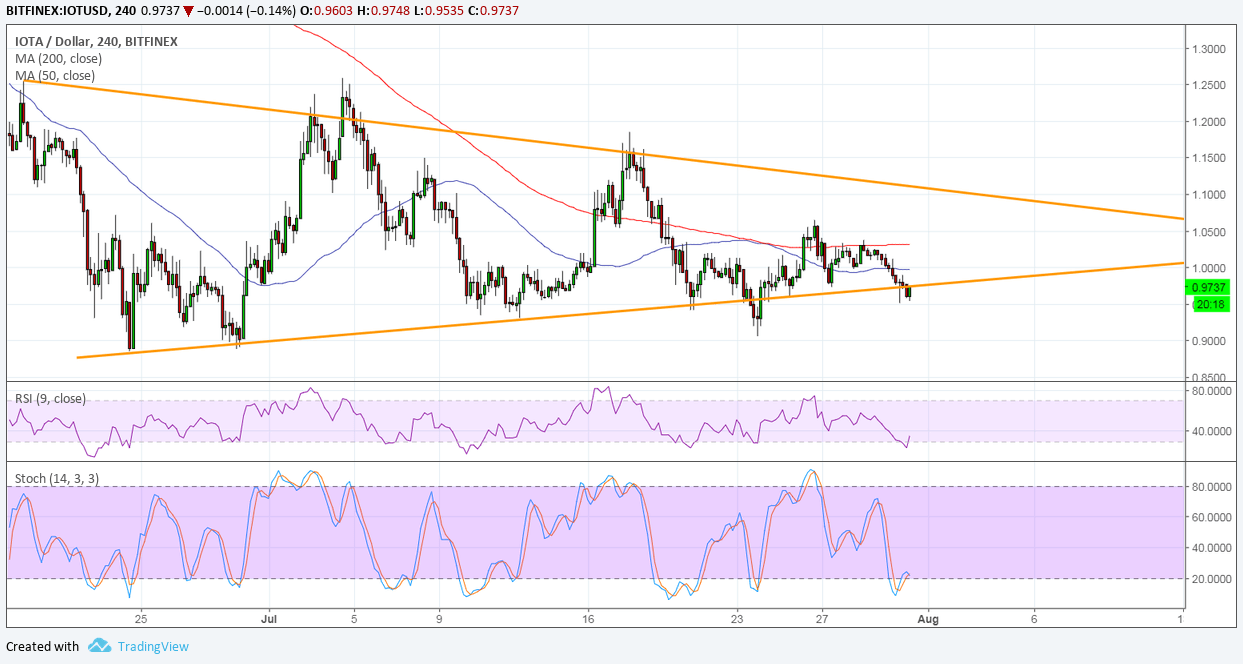
IOTA is currently testing the bottom of its symmetrical triangle and looks ready for a break below support. Technical indicators are looking mixed, though, as moving averages are pointing to bearish momentum while oscillators look ready to turn higher.
The 100 SMA is still below the longer-term 200 SMA to indicate that the path of least resistance is to the downside. In other words, support is more likely to break than to hold or resistance is more likely to hold than to break. The moving averages also seem to have held as dynamic resistance levels and IOTA is trading below them to confirm bearish momentum.
A break below the triangle bottom around 0.9700 could lead to a drop that’s the same height as the chart pattern, which spans 0.9000 to 1.2500. However, RSI is starting to pull up after reaching oversold levels, which means that buyers could take over while sellers take a break.
Similarly stochastic is pulling up from oversold territory so IOTA could follow suit. This might be enough to take price up to the triangle top around 1.1000. A break past this resistance could spur a rally that’s the same height as the triangle formation.

There haven’t been much updates for cryptocurrencies to draw support from so far this week, though, and last week’s SEC decision on bitcoin ETFs didn’t turn out in their favor… at least not yet. The regulator decided to delay their decision on a handful of the applications to give more time to receive feedback while denying the one from the Winklevoss twins again.
Meanwhile, the dollar continues to gain traction thanks to solid growth expectations and hawkish FOMC forecasts. The July jobs report is also due this week and strong results could bring in more dollar gains versus IOTA. On the flip side, weak results could give this pair the bounce it needs.


