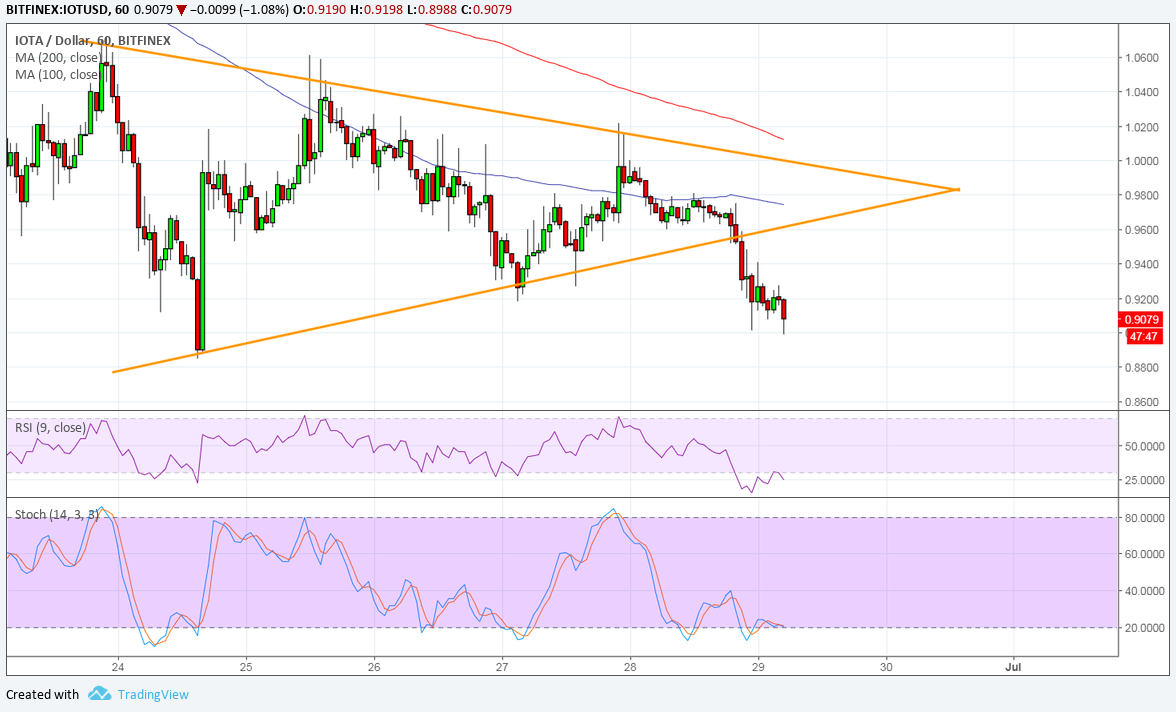
IOTA broke down from its symmetrical triangle consolidation pattern to signal that further losses are in the cards. The chart pattern spans 0.8800 to 1.0600 so the resulting drop could be of the same height.
The 100 SMA is below the longer-term 200 SMA to confirm that the path of least resistance is to the downside. This means that the drop is more likely to carry on than to reverse. However, the gap between the moving averages is narrowing to signal that bearish pressure is slowing.
Stochastic is also pulling out of oversold levels to signal a return in bullish momentum. Similarly RSI is starting to crawl higher, also signaling that buyers are returning while sellers take a break. In that case, IOTA could still pull back to the broken triangle bottom before heading further south.

The dollar has been strongly supported for the most part of the week as the Trump administration showed signs of tempering its trade rhetoric on China. Even though US assets still took losses from time to time, the dollar was able to shore up safe-haven demand.
Meanwhile, altcoins like bitcoin and IOTA continue to lag on regulatory jitters and investor caution. Last week, headlines have been filled with reports on exchanges being hacked and authorities stepping up their efforts to oversee cryptocurrency activity. More headlines on these concerns could continue to dampen gains in the cryptocurrency arena.
Still, it’s worth noting that IOTA continues to forge partnerships with more companies, setting up for more applications down the line. IOTA has formed a partnership with Norway’s biggest bank, DNB, and is also rumored to be working with Volkswagen for their Connected Car System. DnB showed interest in blockchain tech and crypto assets numerous times before in initiating the partnership with IOTA.


