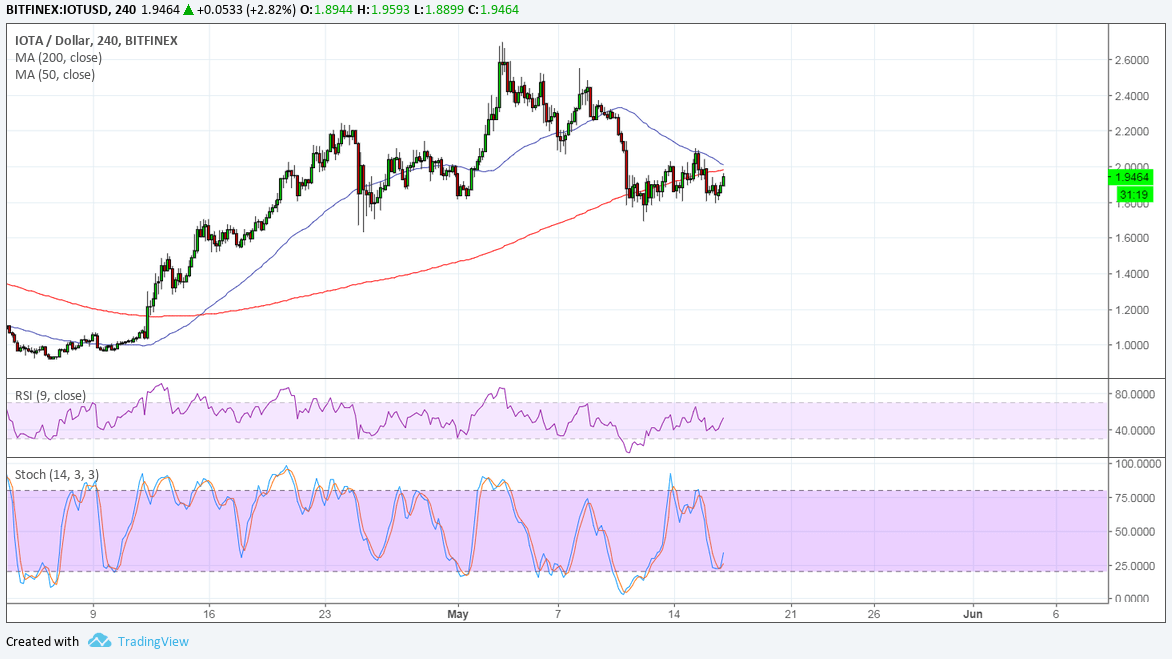
IOTA could be in for a rally as it formed a double bottom reversal pattern right on a major support area. Price has yet to break past the neckline around 2.1000 to confirm the potential climb.
The 100 SMA is below the longer-term 200 SMA to suggest that the path of least resistance is to the downside or that the selloff is more likely to resume than to reverse. However, IOTA has also moved past the 100 SMA dynamic inflection point to reflect a pickup in buying pressure.
On the 1-hour chart, RSI is moving up to show that buyers have the upper hand but is also closing in on overbought levels. Similarly, stochastic is pointing up but dipping into overbought territory, so selling pressure might return soon.

On the 4-hour time frame, IOTA is still above the neckline of the head and shoulders pattern. This signals that further losses are due, especially if price breaks below the neckline at 1.8000.
The 100 SMA looks ready to cross below the longer-term 200 SMA on this time frame to signal a return in bearish momentum.

RSI is still heading north, though, so price could follow suit and lead to a move past the SMA dynamic inflection points. Stochastic is just turning higher and has plenty of room to climb so buyers may stay in control for a bit longer.
Then again, dollar demand has been mostly supported for the past few days so there may be a stronger chance of seeing a break lower than a double bottom upside break. This head and shoulders pattern spans 1.8000 to 2.6000 so the resulting drop could be of the same height.
For now, it might be best to see how price reacts to the double bottom pattern on the 1-hour chart and a break below the bottoms could be enough to confirm that the head and shoulders signal is validated.


