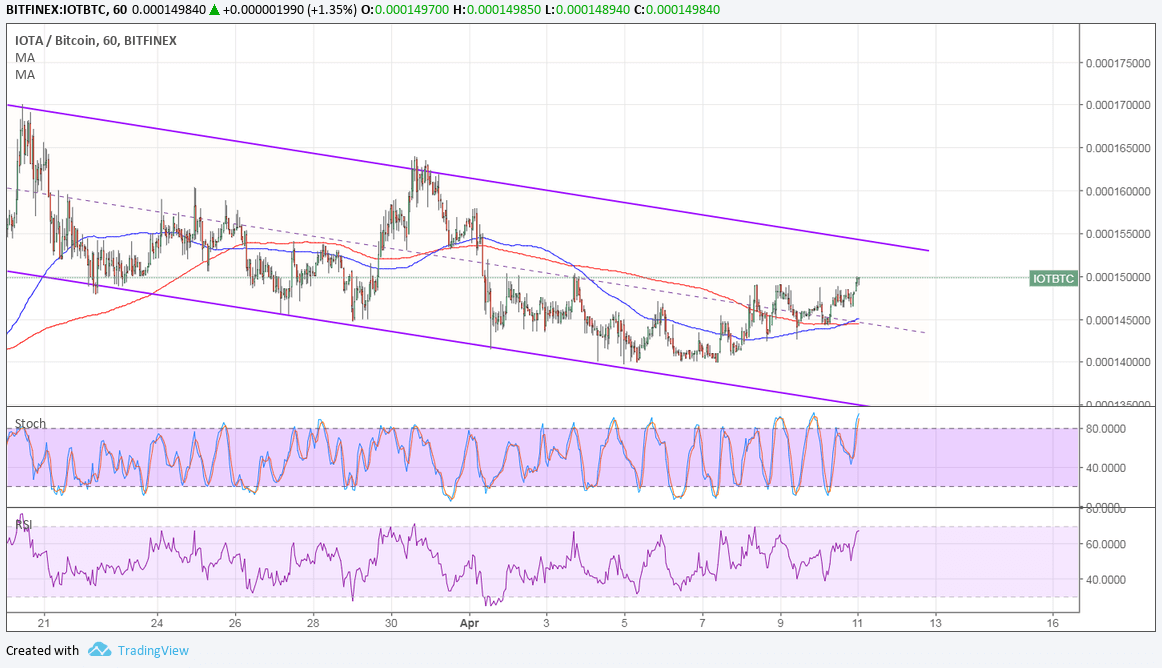
IOTA is trending lower to bitcoin still, moving inside a descending channel on the 1-hour chart but looking ready for a test of resistance. If the top around 0.00015 holds, another move towards support at 0.00013 could be seen.
The 100 SMA is crossing above the longer-term 200 SMA, though, so the path of least resistance could be to the upside. In that case, bulls have a chance at pushing past the resistance and spurring a reversal from the downtrend.
Stochastic is pointing up to show that buyers have the upper hand but this oscillator is in overbought territory already. Turning back down could draw sellers in, leading to a dip to the bottom of the channel or at least the mid-channel area of interest. RSI is on the move up so there may be some bullish pressure left before sellers return.

Againts the dollar, IOTA is in a falling wedge pattern and could be due for a breakout soon. Price is currently testing the resistance and a move past 1.000 could lead to an uptrend.

However, the 100 SMA is below the longer-term 200 SMA on this time frame to signal that the path of least resistance is to the downside. In other words, resistance is more likely to hold than to break, sending price back down to support.
Stochastic is moving up but also dipping into overbought territory to signal weakening bullish pressure. RSI has some room to climb but could also bring sellers back in once it reaches the overbought region.
The wedge pattern spans 0.900 to 2.200 so the resulting break could lead to a move of the same magnitude. The dollar has a few catalysts lined up, namely the CPI release and the FOMC minutes. PPI data beat expectations so there’s a strong chance for an upside CPI surprise. Meanwhile, hawkish FOMC commentary could also shore up the dollar versus IOTA.


