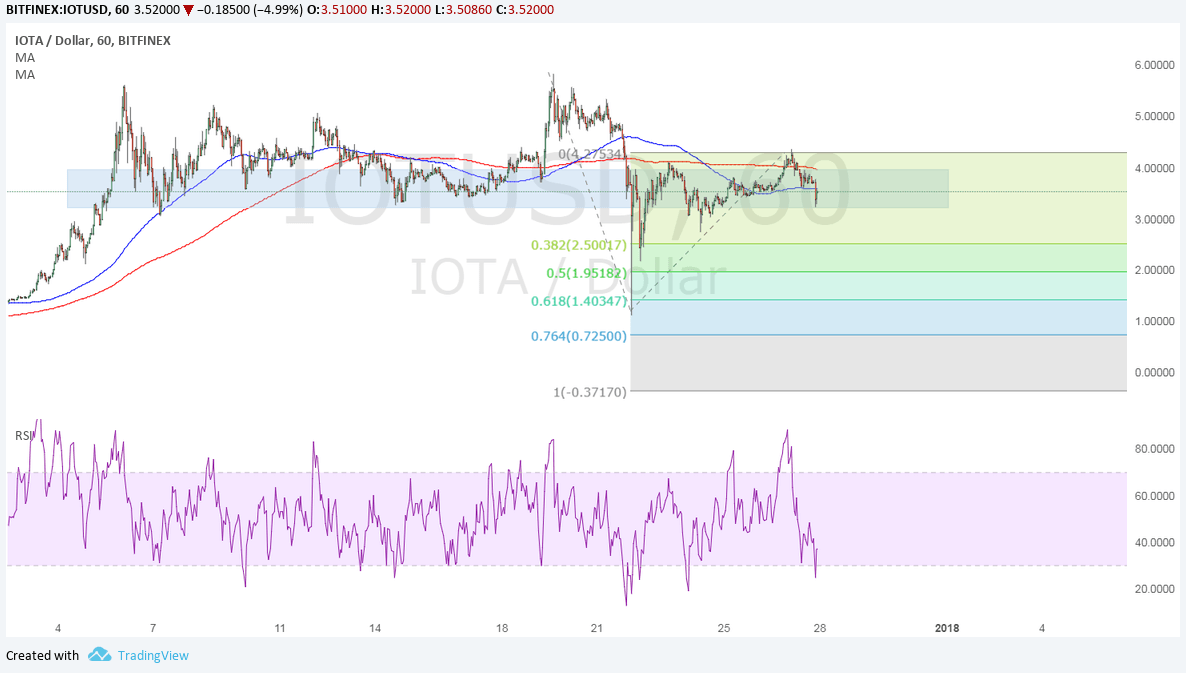
IOTA has previously broken below support around 4.000 then dipped to a low of 1.4035 before pulling back up. Price is currently testing the broken support area, which lines up with a Fib retracement level that’s keeping gains in check.
Now that bearish pressure seems to be picking up, using the Fib extension tool shows how low price could go from here. The 38.2% extension is at 2.5000 then the 50% extension is at 1.9520. The 61.8% extension is at 1.4035 then the 76.4% extension is at 0.7250. The full extension is located below 0.0000.
The 100 SMA is below the longer-term 200 SMA to indicate that the path of least resistance is to the downside. The 200 SMA is holding as dynamic resistance and could continue to keep a lid on the rallies. RSI is heading south also to show that selling pressure is in play.

The dollar has weakened against most of its peers as sentiment over the tax reform law has faded. Data has also been mixed, casting doubts on the impact of tax cuts on consumer sentiment.
Against bitcoin, IOTA is still stuck in another consolidation pattern. Price has formed a new set of higher lows and lower highs to create a symmetrical triangle pattern. Price is approaching the peak of the formation so a breakout could be due soon.

The 100 SMA is below the longer-term 200 SMA to confirm that the path of least resistance is to the downside. This suggests that the selloff is more likely to happen than a rally. Also, the 200 SMA lines up with the triangle resistance, adding to its strength as a ceiling.
RSI is turning higher, though, so a return in bullish momentum might be underway. A breakout in either direction could to a move of the same height as the chart formation.
Bitcoin is currently under pressure on reports that South Korea is stepping up its efforts to curb bitcoin trading. This is one of the cryptocurrency’s largest markets so additional regulation could take its toll on global volumes and activity.


