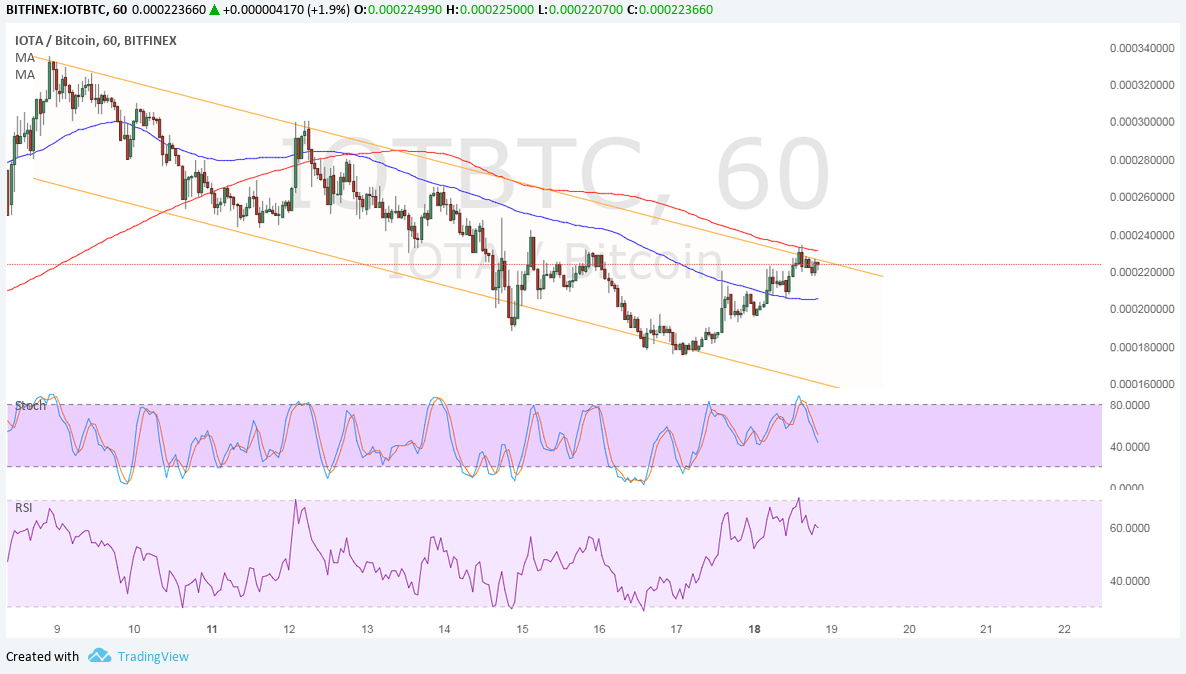
IOTA is trending lower against bitcoin as it moves inside a descending channel on its 1-hour time frame. Price just bounced off support late last week and is now back to testing the resistance at 0.00023.
The 100 SMA is below the longer-term 200 SMA to indicate that the path of least resistance is to the downside. This means that the selloff is more likely to resume than to reverse. Also, the 200 SMA lines up with the channel resistance to add a layer of defense. A move past that level, however, could draw buyers back in.
Stochastic is already pointing down to show that selling pressure is returning, likely taking IOTA back to the channel support around 0.00016 or until the swing low at 0.00018. RSI is also turning lower so IOTA might follow suit as buyers take a break while letting sellers take over.

Against the dollar, IOTA is still stuck in the descending triangle pattern and is currently testing the resistance. If bears defend this level, price could head back down to the triangle support near the 3.5000 mark.

The 100 SMA is also below the longer-term 200 SMA to show that the path of least resistance is to the downside. This indicates that sellers still have the upper hand, especially since stochastic is starting to turn south, too. RSI also looks ready to head down but has a bit more room to climb before indicating overbought conditions.
A breakout in either direction could lead to a rally or selloff in the same height as the chart pattern. The triangle spans 3.5000 to nearly 5.5000, which could yield a big move for IOTA.
Note that US lawmakers are set to make their final vote on the tax bill this week, and approval would allow it to be signed into law by President Trump before Christmas. If so, this would mark the first major legislative victory for the administration, likely leading to more gains in equities and other US assets.


