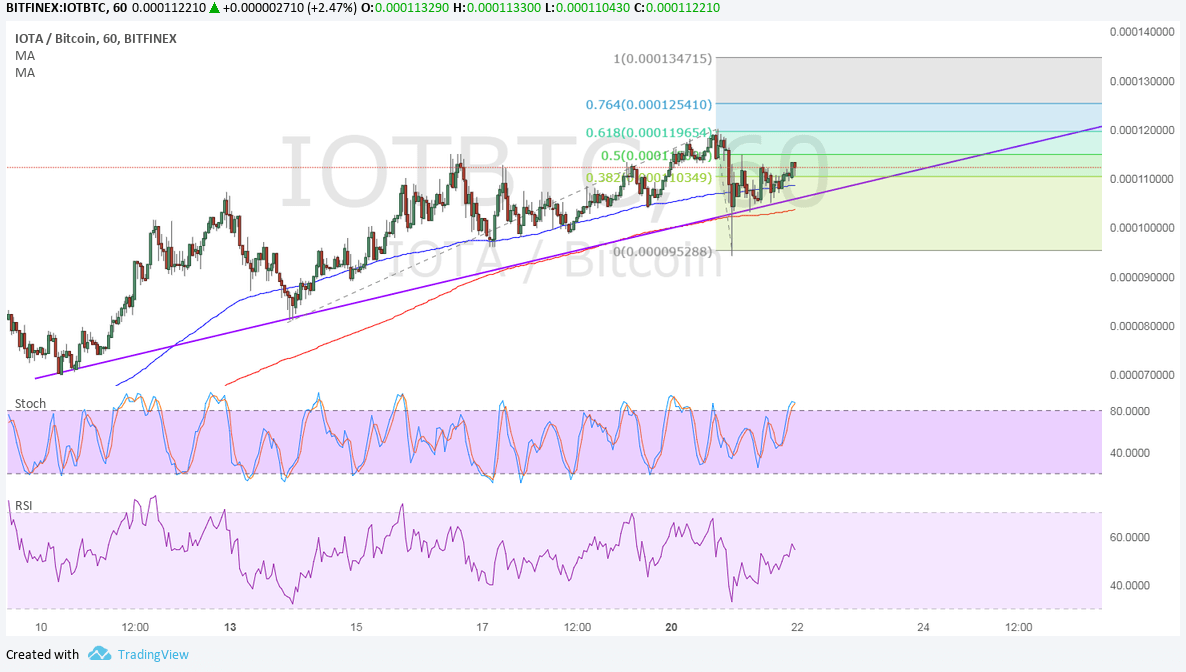
IOTA continues to trend higher and has resumed the climb since pulling back to the correction levels previously highlighted. Using the Fibonacci extension tool on the latest pullbacks shows the next upside targets.
Against bitcoin, IOTA is still hovering around the ascending trend line connecting the lows over the past few days. A bounce could take it back up to the swing high at the 61.8% extension or 0.000119 or to the 76.4% extension at 0.00125. The full extension is at 0.000134.
The 100 SMA is above the longer-term 200 SMA on this chart so the path of least resistance is to the upside. This means that the rally is more likely to continue than to reverse. However, the gap between the moving averages is narrowing to signal weakening bullish momentum. These moving averages are close to the trend line anyway, adding to its strength as a floor in the event of another dip.
Stochastic is pointing up to signal the presence of bullish momentum but is also testing overbought territory to indicate a potential return in selling pressure. RSI has more room to climb so buyers might be able to stay on top of their game for a bit longer.

Against the dollar, IOTA appears to have already made a strong bounce off the trend line and area of interest around 0.8000. Price has moved past the 38.2% extension and is setting its sights on the 50% extension at 0.9400. The 61.8% extension is at 1.00294 then the 76.4% extension is at 1.06880. The full extension is at 1.17525.

The 100 SMA is also above the longer-term 200 SMA on this time frame so the path of least resistance is to the upside. The gap between the moving averages is widening to reflect stronger bullish pressure while the 200 SMA lines up with the trend line to add to its strength as a floor.
Stochastic is heading north so IOTA could follow suit. Similarly RSI is moving up to show that buyers are currently in control and could push for more gains versus the dollar.


