IOTA continues to trend higher since bottoming out from a longer-term selloff. Price is in the middle of a correction on its short-term rallies, though, providing bulls with an opportunity to go long at better levels.
Against bitcoin, IOTA is closing in on its ascending trend line connecting the lows for the most part of the month. This lines up with the 50% Fibonacci retracement level and an area of interest or former resistance. It also coincides with the 100 SMA dynamic inflection point, which adds to its strength as a floor.
Speaking of moving averages, the 100 SMA is above the longer-term 200 SMA on the 1-hour chart so the path of least resistance is still to the upside. This means that the uptrend is more likely to continue than to reverse. However, the gap between the moving averages is narrowing to signal weakening bullish momentum.
Stochastic is moving lower to show that sellers are still in control of price action. RSI also has room to head south so IOTBTC could follow suit and turn higher when both oscillators hit oversold levels and turn back up.

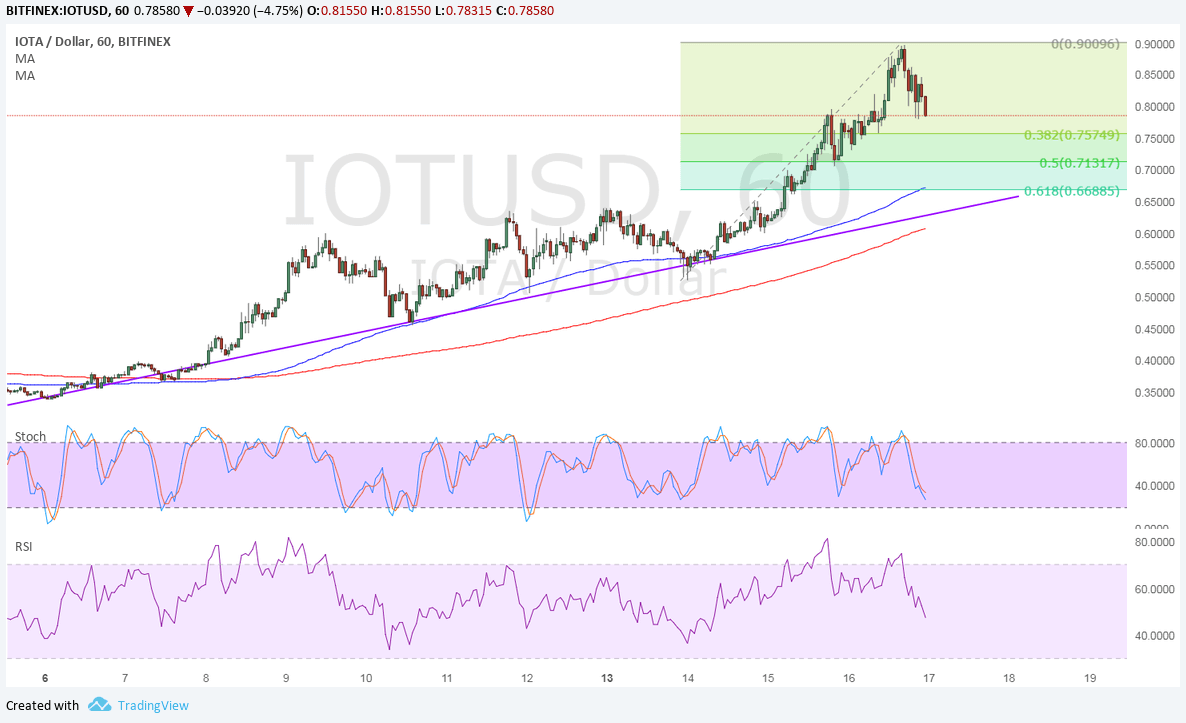
Against the dollar, IOTA is also in correction mode but has quite a long way to go before hitting its ascending trend line. Instead, price could simply find support at the nearby Fib levels, such as the 38.2% level near the .7500 mark.
A larger pullback could last until the 61.8% Fib at the 100 SMA dynamic support just slightly above the trend line and .6500 level. The 100 SMA is also above the longer-term 200 SMA to reflect that the uptrend is likely to carry on.

Stochastic and RSI are both on the way down as bears remain on top of their game and could push for more losses. The 200 SMA could be the line in the sand for this uptrend as a break below that inflection point could signal a return in bearish momentum.


