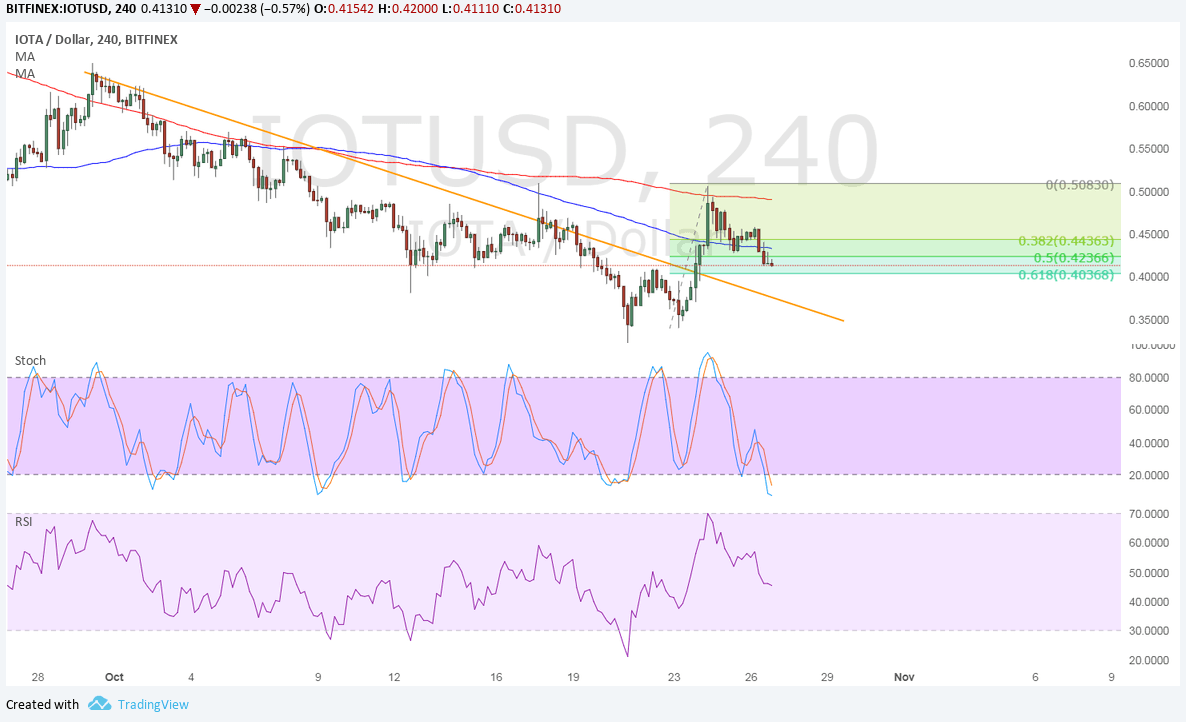
IOTA has recently broken above its descending trend lines against the dollar and bitcoin, signaling readiness for a reversal. Price has since started to show signs of pulling back, so applying the Fibonacci retracement tool on the latest swing high and low could show potential support zones.
Against bitcoin, IOTA, is hovering around the 50% Fibonacci retracement level after finding resistance at the 100 SMA dynamic inflection point a few days back. The 100 SMA is still below the longer-term 200 SMA so the path of least resistance is to the downside, and the gap between the moving averages is widening to reflect strengthening bearish momentum.
However, stochastic is already indicating oversold conditions and pulling up. This could mean that buyers are ready to get back in the game and allow IOTA to move back up to the swing high or higher. RSI, on the other hand, has plenty of room to drop so bearish pressure could stay in play for a while until this oscillator hits oversold levels.
The 61.8% Fib could serve as the next support zone while a much deeper correction could last until the broken trend line closer to 0.00006.

Against the dollar, IOTA is also in correction mode and is approaching the 61.8% Fibonacci retracement level. This area of interest is close to the 0.4000 major psychological level and a former neckline of a small double bottom formation.
The 100 SMA is also below the longer-term 200 SMA on this time frame so the path of least resistance is to the downside. This means that the selloff could still resume, especially since RSI is pointing down to show that sellers are in control.

Stochastic is also pointing down but is dipping into oversold territory, which suggests that bears might want to take a break soon and let bulls take over. If so, a bounce back to the swing high just past 0.5000 could be seen.
The dollar has several catalysts on its plate, including the upcoming advance GDP release for Q3 and Trump’s announcement of his Fed Chairperson appointee.


