IOTA is still trending lower versus bitcoin but is testing another resistance level at the top of its falling wedge. An upside break could lead to a reversal from the drop. Note that the wedge spans 0.00012 to 0.00026 so the resulting rally could be of the same height.
However, the 100 SMA is below the longer-term 200 SMA to signal that the path of least resistance is to the downside or that the selloff is likely to carry on. The 200 SMA has held as dynamic interest in the latest test.
Stochastic is on the move up, though, which means that there’s some buying pressure left. RSI, on the other hand, is turning lower to signal a return in selling pressure. This could be enough to take IOTA down for a test of the wedge support.

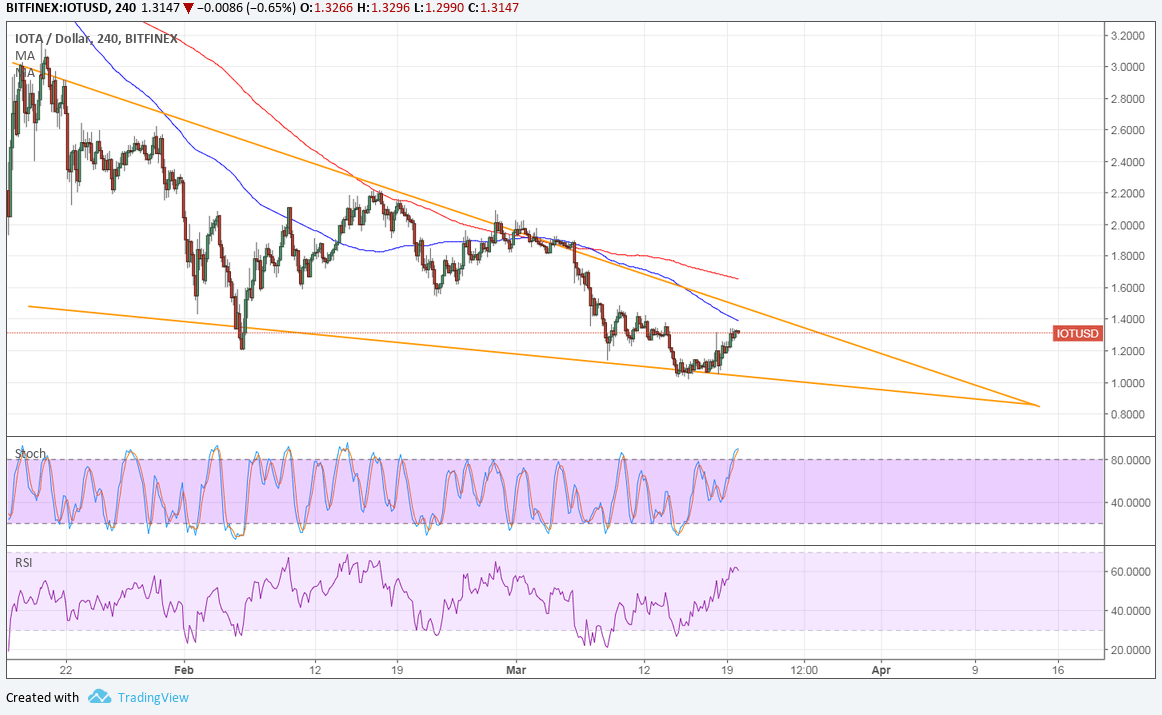
IOTA is also in a wedge pattern versus the dollar and is just bouncing off support. Price is nearing the 100 SMA dynamic inflection point which might serve as resistance.
This moving average is below the longer-term 200 SMA to confirm that the path of least resistance is to the downside. The gap between the moving averages is even widening to reflect strengthening bearish pressure. In that case, a break below the wedge support could happen and spur a sharper tumble.

Stochastic is moving up but dipping into overbought territory to signal that buyers are tired. RSI has some room to climb, so a test of the wedge resistance could be underway before selling pressure picks up. A move below the 0.9000 mark could be enough to spur a bearish trend.
The dollar has the FOMC statement coming up and a 0.25% hike is strongly expected. A hawkish announcement that hints of more tightening moves in the coming months could spur both currency demand and a flight to safety, which would be dollar bullish. On the other hand, a dovish hike with plenty of cautious remarks could spur dollar declines and a rally for IOTA.


