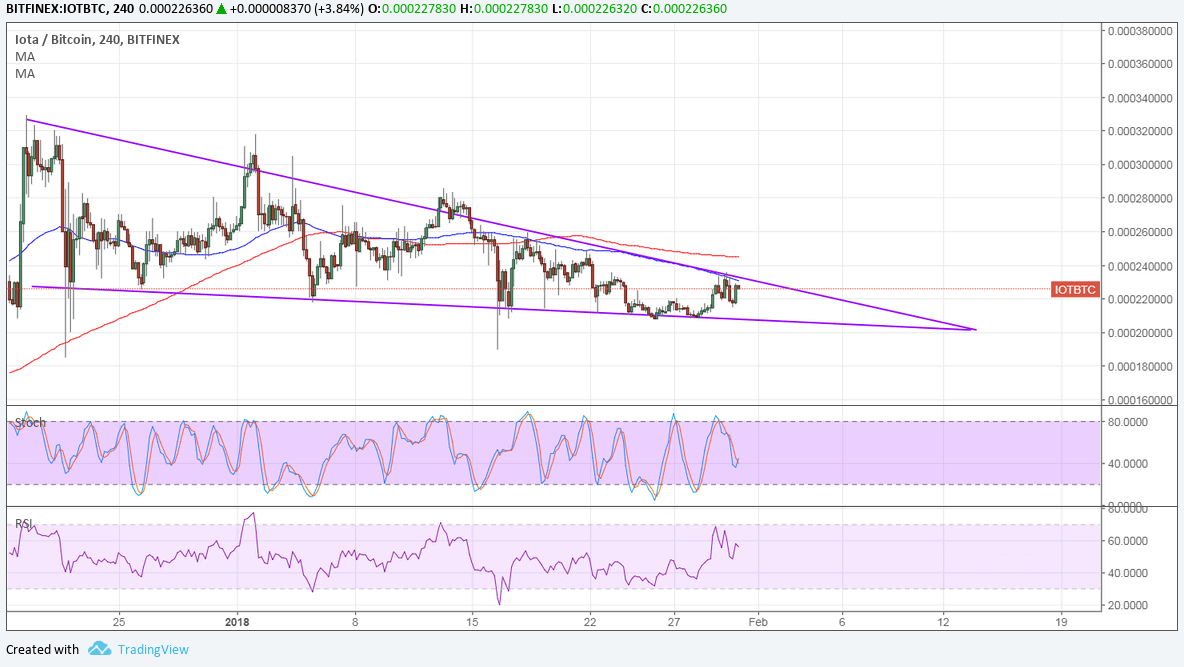
IOTA is still consolidating against the dollar and bitcoin while investors wait for a big catalyst to set direction. Against bitcoin, IOTA is in a falling wedge formation visible on the 4-hour time frame.
The 100 SMA is below the longer-term 200 SMA to signal that the path of least resistance is to the downside or that the selloff is more likely to resume than to reverse. At the same time, the 100 SMA is holding as dynamic interest right in line with the wedge resistance.
Price is currently testing this ceiling while stochastic is on the move down to confirm that sellers are in control. RSI also seems to be heading south so IOTA could follow suit and test or even break the wedge support. Note that the chart pattern spans 0.00022 to 0.00030 so the resulting breakout could be of the same height.

Against the dollar, IOTA is in a descending triangle pattern and is currently testing support. A bounce off this area could lead to a test of the triangle resistance near the moving averages at 2.5000.
The 100 SMA is slightly above the longer-term 200 SMA to suggest that the path of least resistance is to the upside. In other words, support is more likely to hold than to break.

At the same time, stochastic is pulling higher to reflect the presence of bullish momentum. RSI is also turning up from the oversold region to indicate a return in buying pressure as well.
Keep in mind, however, that there are still several catalysts lined up for the dollar this week. Although the State of the Union address didn’t trigger much of a reaction from the US currency or financial markets in general, the FOMC statement could still be a mover. No actual rate changes are eyed but traders are watching closely for any changes in tone.
Apart from that, the ADP non-farm employment change could also prove to be a catalyst as it would set expectations for the NFP. Stronger than expected jobs data could keep tightening expectations in check while weak figures could mean more dollar weakness.


