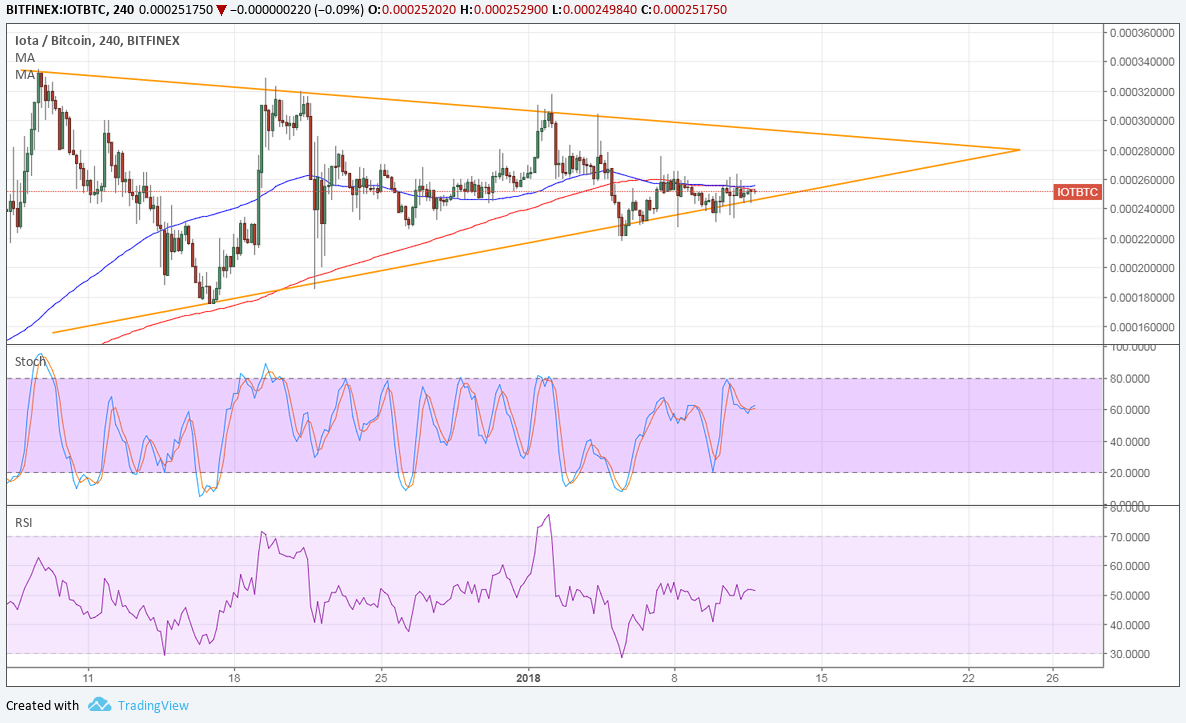
IOTA is treading sideways against both bitcoin and the dollar but could be due for a stronger bounce against the former. Price is currently testing the ascending triangle support and might be ready to move up to the resistance near 0.00029.
The moving averages are oscillating to reflect consolidation conditions and are also currently holding as near-term resistance. In that case, a downside break might be possible, sending IOTBTC down by 0.00014 or the same height as the triangle pattern.
Stochastic also looks ready to head lower to indicate a pickup in selling pressure. RSI is on the move up but cruising sideways at the middle of its range as the consolidation continues.

Against the dollar, IOTA is also near the bottom of its range and might be due for a bounce higher. However, there’s also strong resistance at the middle of its range around 4.0000 and might take a stronger catalyst to buoy it higher.
The 100 SMA is below the longer-term 200 SMA on this chart, so the path of least resistance could be to the downside. Stochastic is also on the move down to indicate the presence of selling pressure.

A drop below support around 3.0000 could lead to a selloff of around 2.150 or the same height as the chart formation. RSI is pulling higher, though, so there’s still a chance buyers could keep defending the floor.
This could hinge on the upcoming CPI report that might set the tone for Fed tightening this year. Note that PPI disappointed, which suggests a potential downside surprise for inflation, but retail sales could still post an upside surprise.
As for bitcoin, the cryptocurrency is reeling from news that South Korea plans to ban bitcoin trading in the country. This is currently the largest network for bitcoin so a drop in global activity could weigh on prices as well.


