
 Bilal Hassan·3d ago

Ethereum trades near $2,683 as $2,800 resistance, $2,592 support and cooling MACD momentum shape the near-term outlook.
Ethereum is now heading back to a price resistance area that has been a recurring theme over the last few years, trading close to $2,678 following its lows from mid-2026. The $2,650 to $2,900 price range has become the primary technical area to be monitored, and the $2,800 price is close to a buying resistance level.
ETH is maintaining the bull market structure from the previous two downtrends, holding above the 0.786 Fibonacci retracement in the daily chart slightly above $2,592. Momentum indicators are more mixed; the Relative Strength Index is above neutral while the MACD is signaling some short-term waning momentum.
Analysts are also focusing on the same broad resistance area, although their observations differ in timeframe and upside targets. Daan Crypto Trades is monitoring Ethereum’s weekly structure at $2800, whereas Gerla believes there is a chance that it could break above the broader range of $2650 to $2900 and reach far higher levels.
Market analyst Daan Crypto Trades said Ethereum is currently trading between its weekly 200 moving averages and the $2,800 horizontal resistance level. He noted that the area has repeatedly acted as both support and resistance over the past two to three years, making it an important reference point for the current recovery.
$ETH Now stuck between its Weekly 200MA/EMA and $2.8K horizontal level.
This horizontal area has played a critical role in ETH's price action for 2-3 years now. Acting as a strong support & resistance many times.
So keep an eye on the weekly closes around this region. pic.twitter.com/XbpGjkbbLl
— Daan Crypto Trades (@DaanCrypto) October 1, 2026
His analysis places particular emphasis on weekly closes rather than brief intraday moves around $2,800. A sustained weekly close above the region would show that Ethereum is beginning to move beyond an area that has repeatedly limited previous advances.
The daily chart supports the importance of the broader resistance zone, with ETH currently trading above the 0.786 Fibonacci retracement at $2,592. The next major Fibonacci resistance sits near $2,962, followed by the 0.5 retracement level around $3,222.
Read also: Crypto Investment Products See $3.55B Weekly Inflows, CoinShares Reports
Gerla, a crypto analyst, independently selected the $2,650-$2,900 price range as the primary area that Ethereum needs to break. The analyst noted that the ETH price chart is currently in a difficult position for bears to get into the market with the price trading around $2,700.
$ETH at $2700 and this chart is starting to look dangerous for the bears.
$2,650–2,900 is the key zone. Clear that, and I’m expecting $ETH to accelerate hard.
The bigger target stays $4,800–5,200.
This doesn’t look like a trend I want to fade. pic.twitter.com/06br4Cu206
— Gerla (@CryptoGerla) October 1, 2026
Gerla is looking for confirmation of a breakout above the zone to give Ethereum the chance to move at a higher pace, but has a larger range of $4,800 to $5,200 in mind. That is still a steep goal to achieve, and would require Ethereum to pierce through a number of resistance levels on the daily chart.
Those resistance levels are about $2962 and $3222, with a higher area around $3450–$3500. The $4800-$5200 range is thus more of a longer timeframe analyst target rather than a more immediate technical level.
Ethereum’s RSI is at 61.28, just below the overbought level of 70 and above the neutral level of 50. The reading indicates that there is still some positive momentum, but has relaxed from some of the higher highs seen recently as ETH nears resistance.
The short-term picture is less sunny in the MACD, as the MACD line is above the signal line but both are below the 73.8 mark. The histogram is also negative at about -9.6, which suggests that momentum has been slowing following the recent recovery.
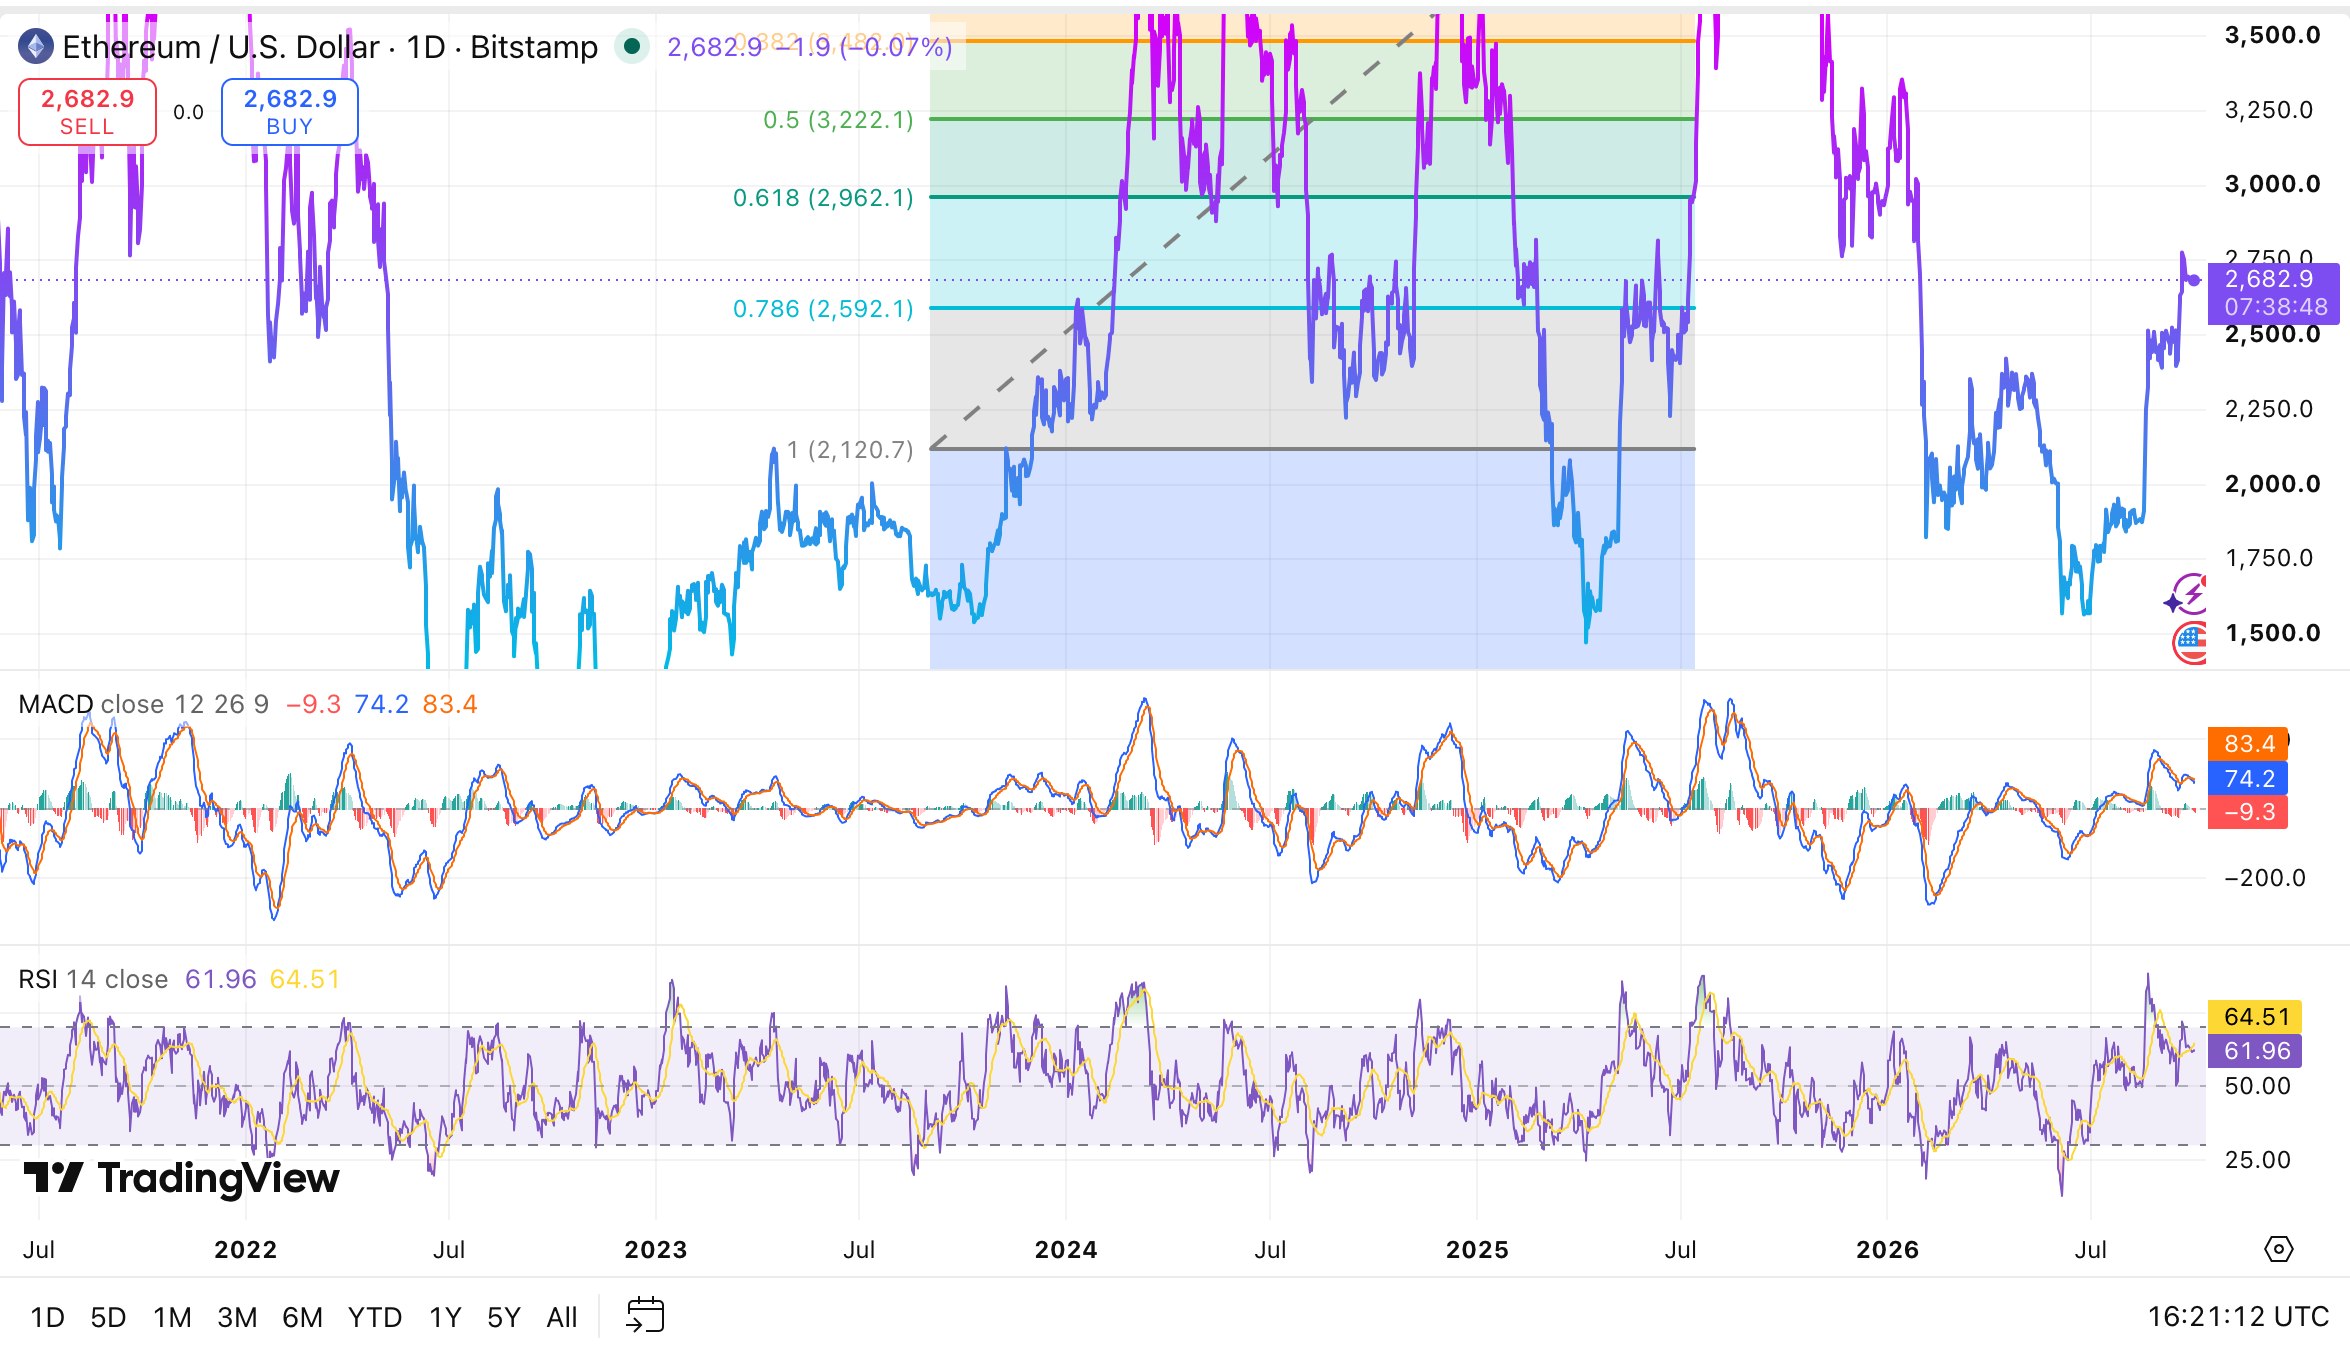
Ethereum is currently exceeding the technical setup’s $2,800 to $2,900 resistance level and chopping around above the $2,592 Fibonacci support level. If it continues to move through that area a shift toward $2,962 and $3,222 are expected to bring attention back to that area.
Besides, if it breaks below $2,592, then it could take attention back to the $2,500 area and more bearishly to $2,120.
Related News
Explore more