- Ethereum price extended its decline below the $150 and $120 support levels against the US Dollar.
- ETH price traded as low as $89 and it is currently correcting higher.
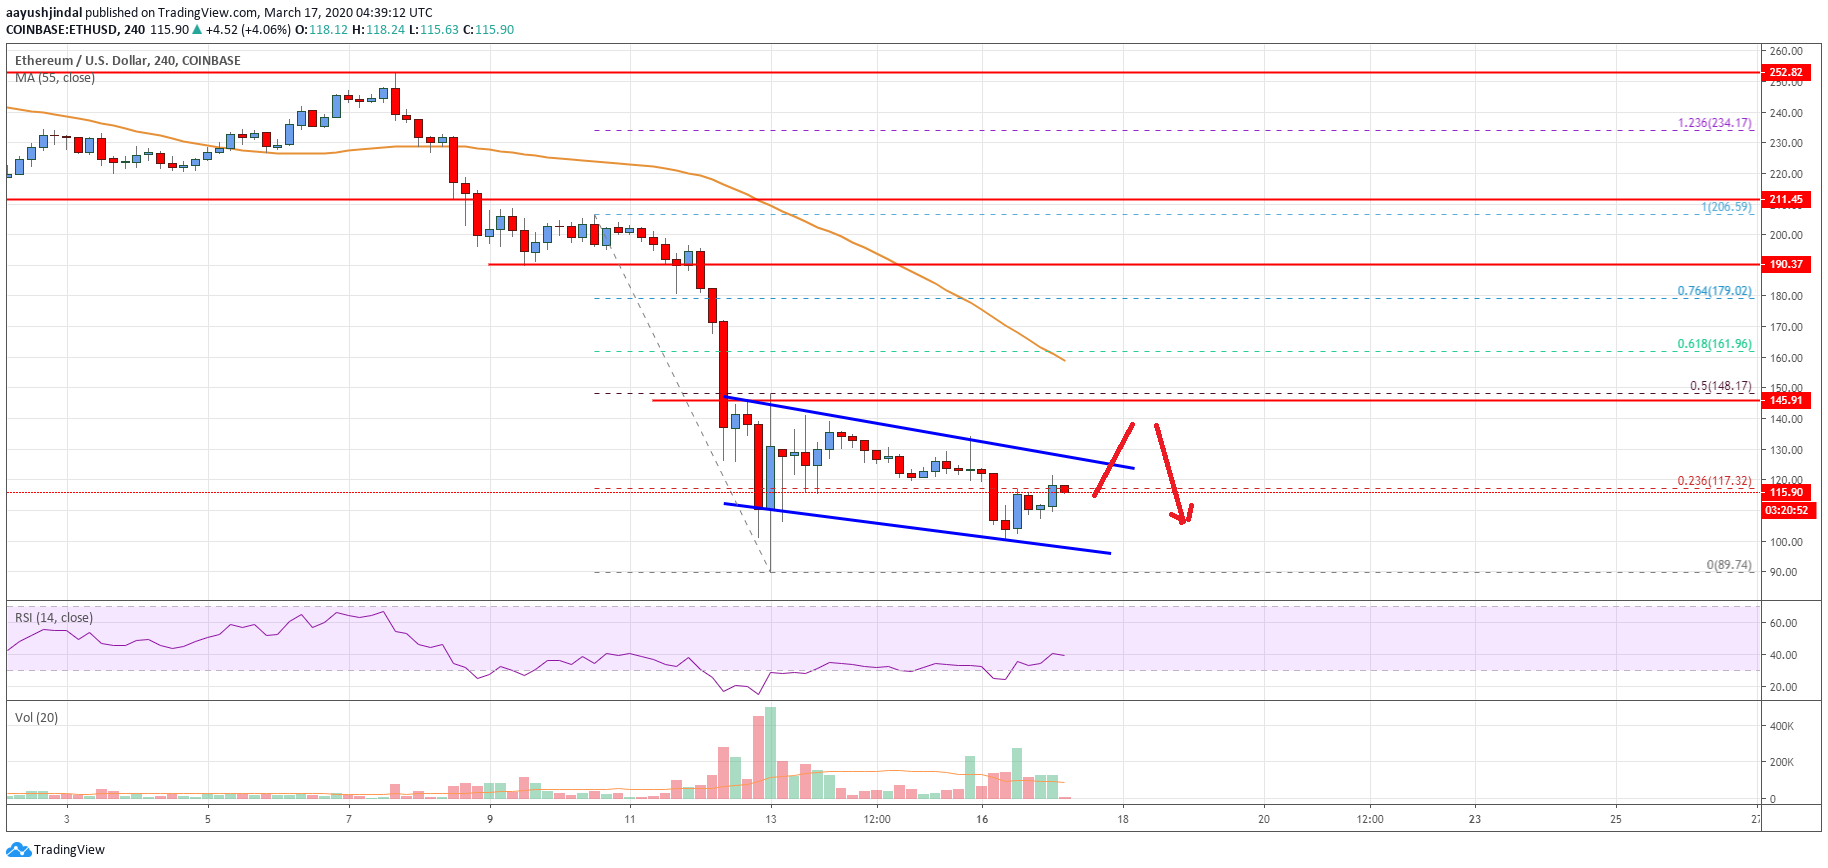
- There is a key declining channel forming with resistance near $125 on the 4-hours chart (data feed from Coinbase).
- The price could correct higher, but it is likely to face a lot of hurdles near $145 and $150.
Ethereum price is back in a strong downtrend below $150 against the US Dollar. ETH/USD remains at a risk of more losses unless it settles above $145-$150.
Ethereum Price Analysis
In the past few days, there was a nasty decline in Ethereum price below the $150 support against the US Dollar. ETH price even settled below the $145 pivot level and the 55 simple moving average (4-hours).
The decline was such that the price even dived below the $120 and $100 support levels. The price traded to a new 2020 low at $89 and it is currently correcting higher. There was a break above the $100 and $105 levels.
It is currently trading near the 23.6% Fib retracement level of the key decline from the $252 high to $89 low. On the upside, an initial resistance is near the $125 and $130 levels. Moreover, there is a key declining channel forming with resistance near $125 on the 4-hours chart.
If there is an upside break above the channel resistance, the price could start a decent recovery. An initial resistance is near the $135 level, above which the price may possibly test the main $145 resistance.
The 50% Fib retracement level of the key decline from the $252 high to $89 low is near the $148 level to act as a hurdle. The main resistance is near the $150 level, above which the price is likely to turn green.
Conversely, the price is likely to fail near the $125 and $130 resistance levels. In the mentioned case, there are chances of a fresh decline below the $110 and $105 levels in the near term.
Looking at the chart, Ethereum price is clearly back in a major downtrend below $130 and $150. Therefore, it could dive further unless the bulls gain strength and push the price back above the $150 resistance area.
Technical indicators
4 hours MACD – The MACD for ETH/USD is currently losing momentum in the bearish zone.
4 hours RSI (Relative Strength Index) – The RSI for ETH/USD is now near the 40 level.
Key Support Levels – $105, followed by the $100 zone.
Key Resistance Levels – $130 and $145.