- Ethereum price is recovering higher, but it is facing hurdles near $2,650 against the US Dollar.
- ETH price is now trading above $2,500 and the 55 simple moving average (4-hours).
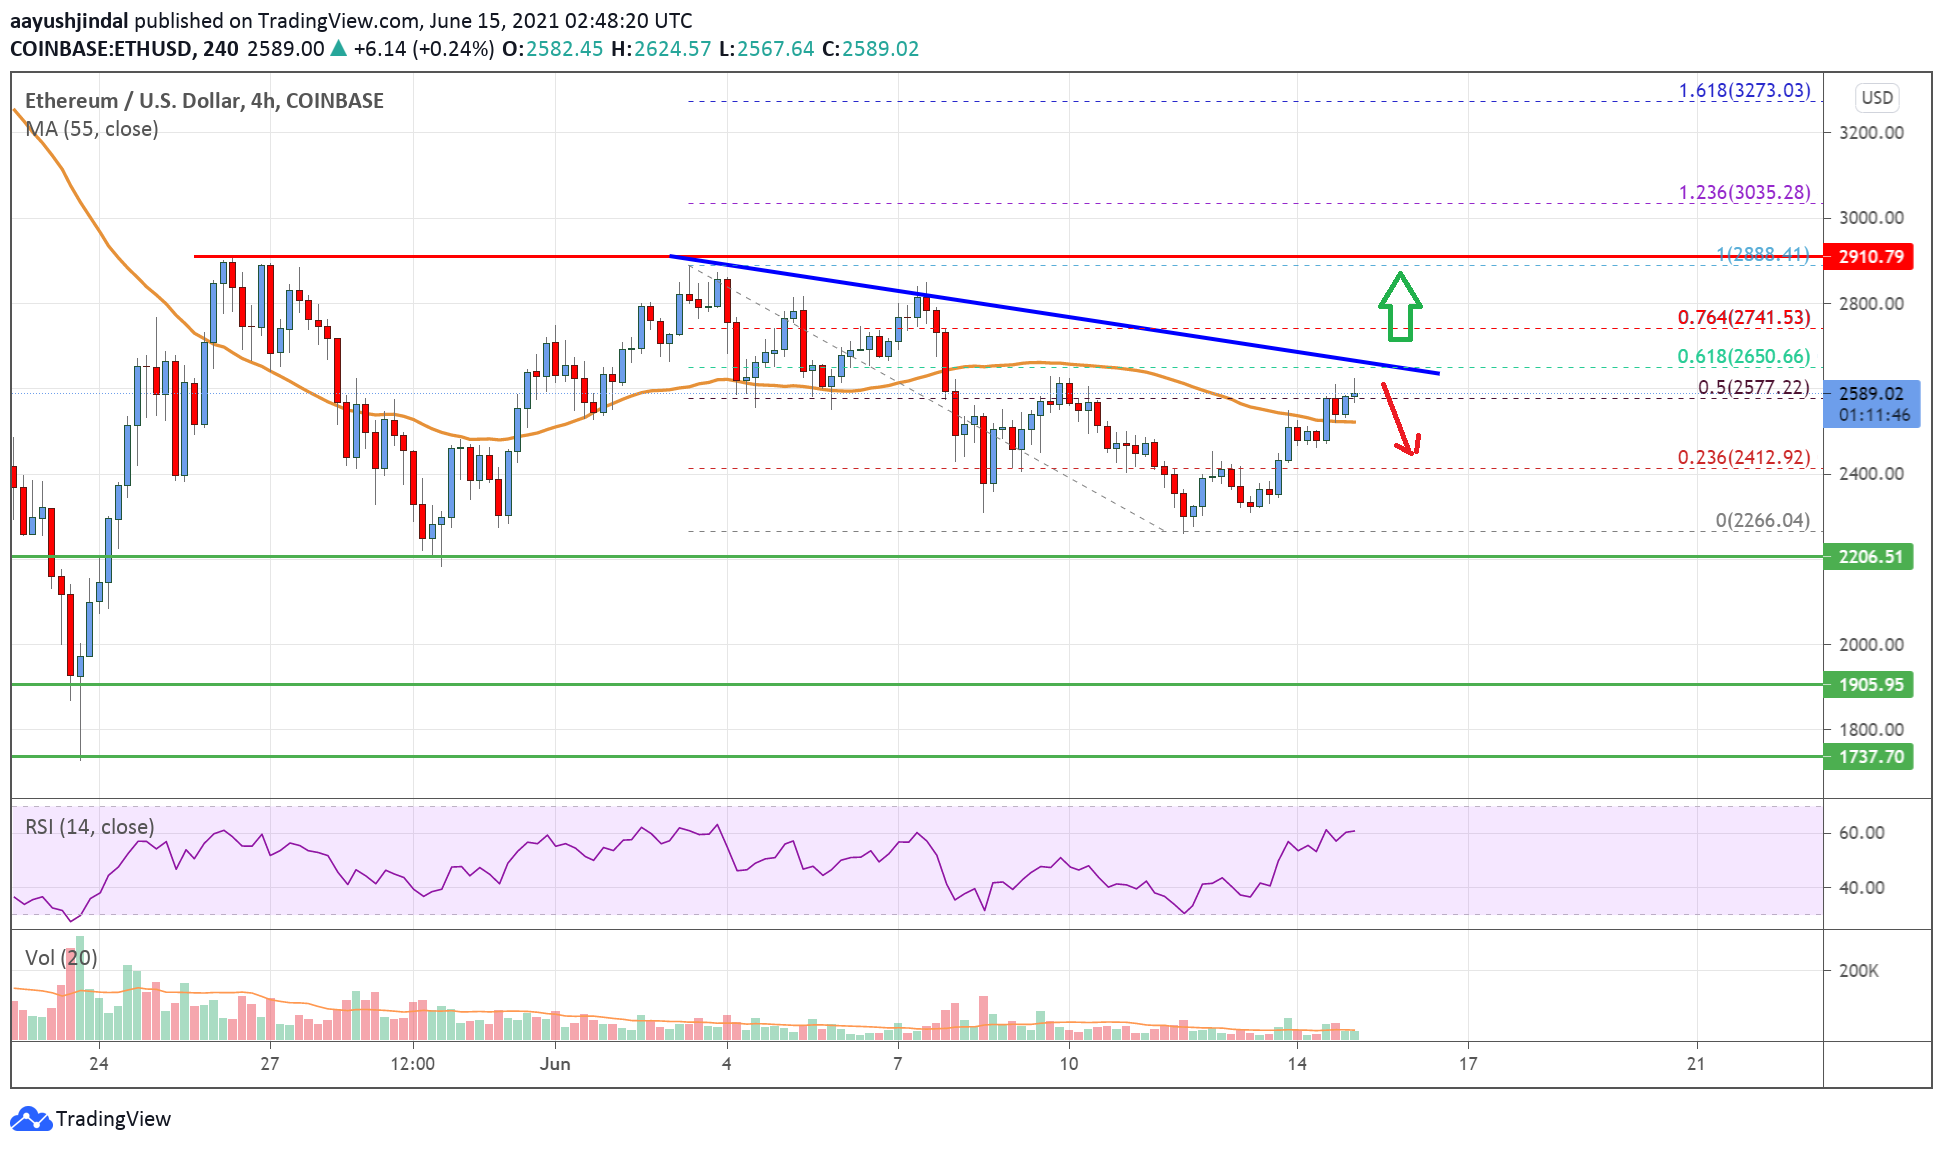
- There is a key bearish trend line forming with resistance near $2,650 on the 4-hours chart (data feed from Coinbase).
- The pair could start a strong increase if there is a clear break above $2,650 and $2,700.
Ethereum price is slowly moving higher above $2,500 against the US Dollar. ETH/USD could either rally above $2,650 or it might start a fresh decline.
Ethereum Price Analysis
Recently, ethereum traded as low as $2,266 before starting an upside correction against the US Dollar. ETH price recovered above the $2,350 and $2,400 resistance levels.
The bulls gained strength and they pushed the price above the $2,500 level. There was also a close above $2,500 and the 55 simple moving average (4-hours). It is now trading near the $2,600 resistance levels. It is also testing the 50% Fib retracement level of the downward move from the $2,888 swing high to $2,266 low.
On the upside, there is a major hurdle forming near $2,650. There is also a key bearish trend line forming with resistance near $2,650 on the 4-hours chart.
The trend line is close to the 61.8% Fib retracement level of the downward move from the $2,888 swing high to $2,266 low. A clear break above the trend line could open the doors for a move above the $2,700 resistance.
The next key resistance is near the $2,800 level, above which the price is likely to aim a test of the $3,000 level in the near term. On the downside, an immediate support is near the $2,500 level and the 55 SMA. The next major support is near the $2,450 level. Any more losses could set the pace for a drop towards the $2,320 support zone in the near term.
Looking at the chart, Ethereum price is clearly trading nicely above $2,500 and the 55 simple moving average (4-hours). Overall, ether price could start a strong increase if there is a clear break above $2,650 and $2,700.
Technical indicators
4 hours MACD – The MACD for ETH/USD is gaining momentum in the bullish zone.
4 hours RSI (Relative Strength Index) – The RSI for ETH/USD is now well above the 50 level.
Key Support Levels – $2,500, followed by the $2,450 zone.
Key Resistance Levels – $2,650 and $2,800.

