- Ethereum price failed to recover above $2,200 and started a fresh decline against the US Dollar.
- ETH price is now trading well below $2,200 and the 55 simple moving average (4-hours).
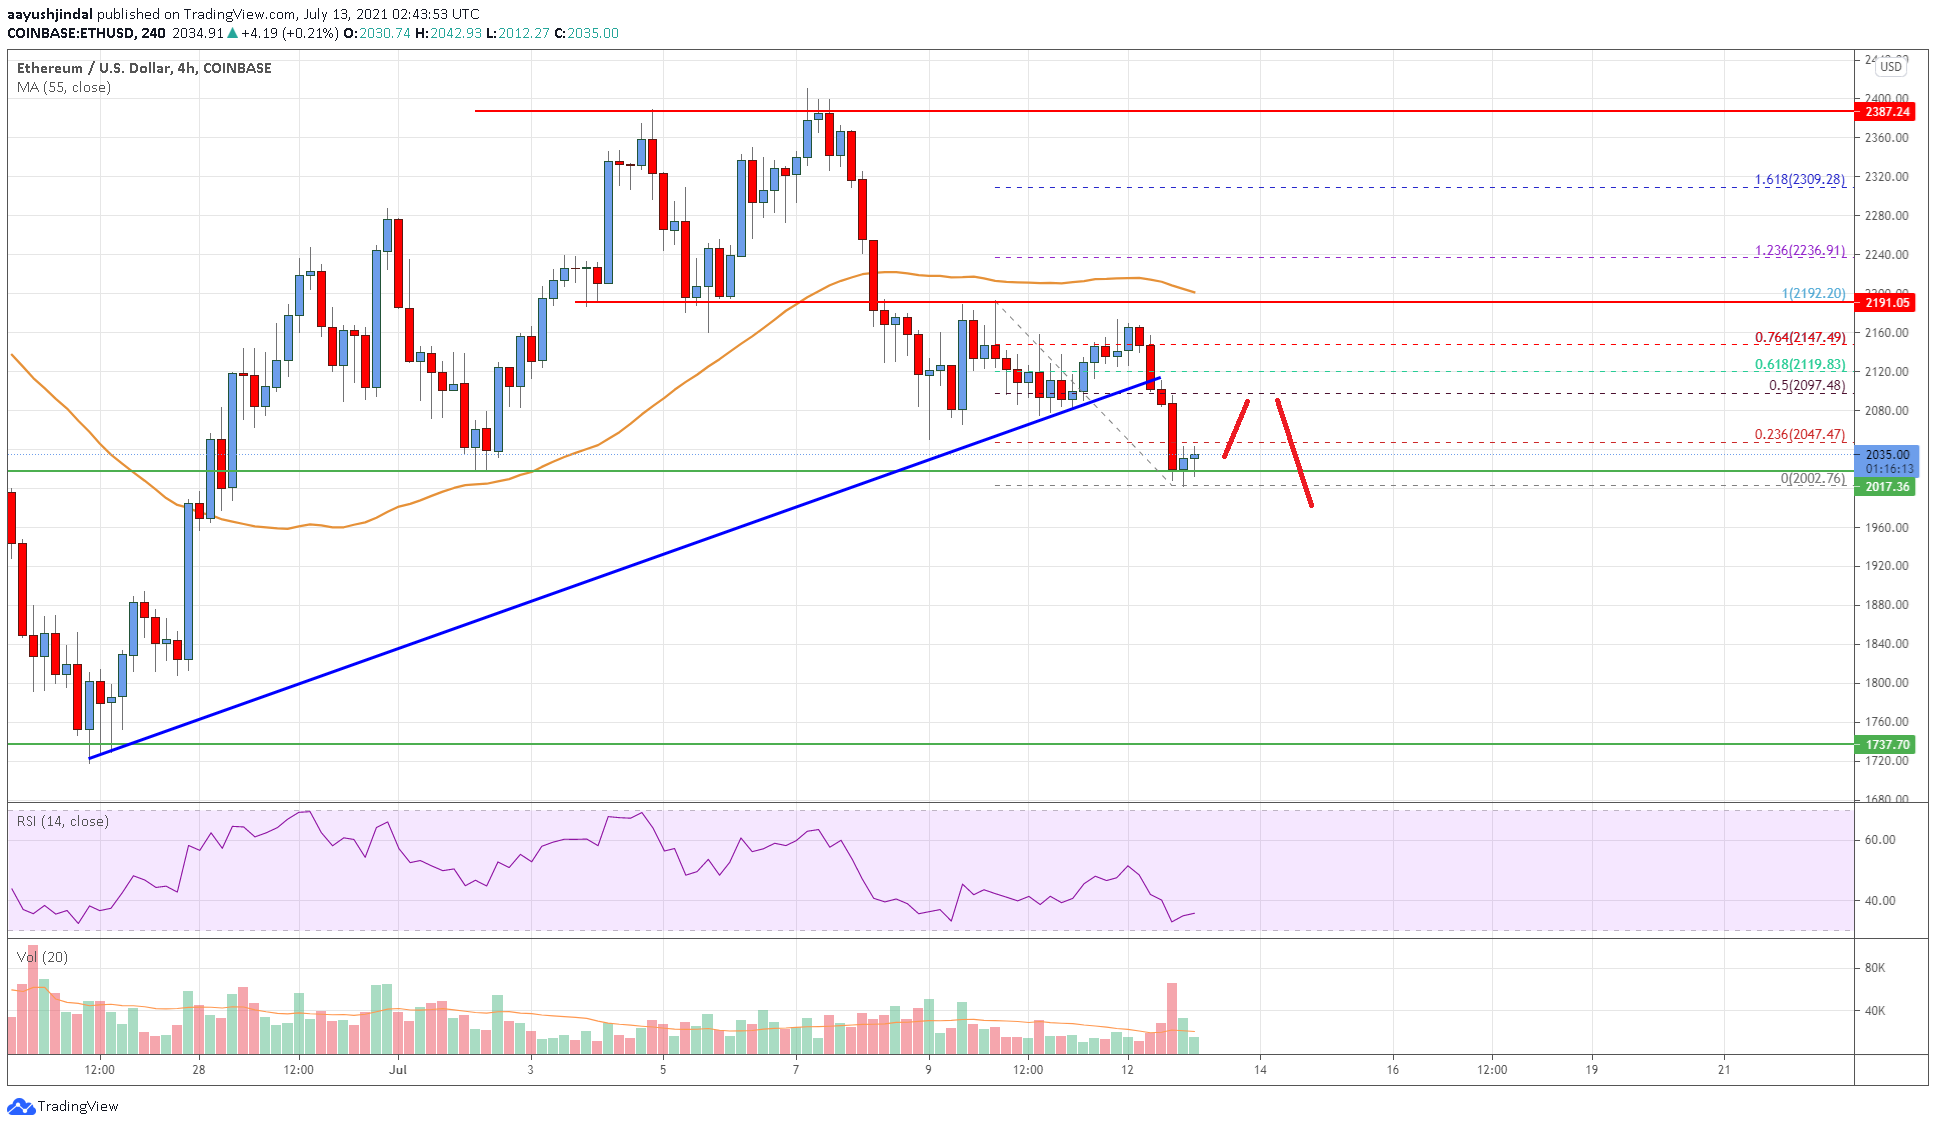
- There was a break below a major bullish trend line with support near $2,100 on the 4-hours chart (data feed from Coinbase).
- The pair is likely to accelerate lower if there is a close below the $2,000 support zone.
Ethereum price is struggling to stay above $2,000 against the US Dollar. ETH/USD could decline heavily if it fails to stay above $2,000 and $1,950.
Ethereum Price Analysis
Recently, ethereum started a decent recovery above the $2,150 level against the US Dollar. ETH price even spiked above the $2,180 level, but it failed to surpass the $2,200 resistance and the 55 simple moving average (4-hours).
A swing high was formed near $2,192 and the price started a fresh decline. It broke the $2,150 and $2,100 support levels. There was also a break below a major bullish trend line with support near $2,100 on the 4-hours chart.
The price even tested the $2,000 support zone. A low is formed near $2,002 and the price is now consolidating losses. An initial resistance on the upside is near the $2,050 level. It is near the 23.6% Fib retracement level of the recent decline from the $2,192 swing high to $2,002 low.
The first major resistance is near the broken trend line and $2,100. It is near the 50% Fib retracement level of the recent decline from the $2,192 swing high to $2,002 low.
A clear break above the $2,100 level may possibly push the price towards the main $2,200 resistance zone. To move into a positive zone, the price must settle above $2,200 and the 55 simple moving average (4-hours).
Conversely, the price could accelerate lower below the $2,000 support. The next key support is near the $1,950 level. Any more losses might lead the price towards the $1,750 support zone.
Looking at the chart, Ethereum price is clearly trading well below the $2,200 zone and the 55 simple moving average (4-hours). Overall, ether price is likely to accelerate lower if there is a close below the $2,000 support zone.
Technical indicators
4 hours MACD – The MACD for ETH/USD is gaining momentum in the bearish zone.
4 hours RSI (Relative Strength Index) – The RSI for ETH/USD is well below the 50 level.
Key Support Levels – $2,000, followed by the $1,950 zone.
Key Resistance Levels – $2,100 and $2,200.